
Normal Probability Curve Demo
Loading the math board and drawing, please wait…
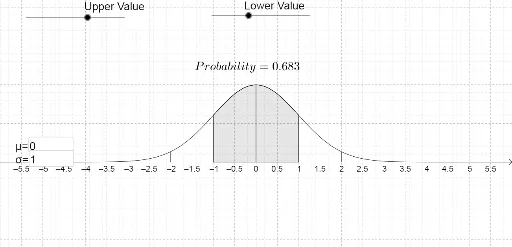
This example demonstrates the construction and properties of a normal probability curve. Key math concepts include probability distributions, integration, mean, and standard deviation. It uses GeoGebra commands like Textfield, Segment, and Integral, along with objects such as Mean and sd, and input boxes for parameter input. Suitable for high school students and those teaching normal distribution applications.
GeoGebra Commands & Parameters
Textfield(Mean) → inputBox1Textfield(sd) → inputBox2Segment(B, A) → aSegment(C, G) → bSegment(D, I) → cSegment(L, O) → dSegment(M, N) → eSegment(H, E) → gSegment(F, J) → hIntegral(f, Lowerx, i) → Upper
AI Drawing Prompt Reference
Draw a demonstration of a normal probability curve including input boxes for mean and standard deviation, showing the curve, mean line, standard deviation lines, and integral area. Start with the input boxes and curve, then add the mean and standard deviation lines, and finally highlight the integral area.
The prompt above was compiled from the original drawing commands and is for reference only.