
Normal Distribution Probabilities
Loading the math board and drawing, please wait…
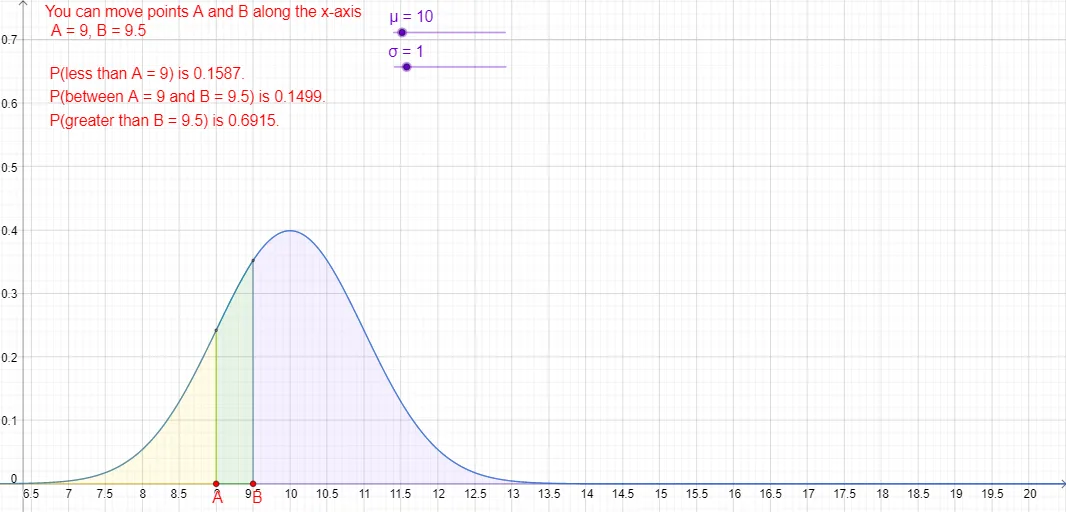
This example demonstrates the calculation of probabilities in a normal distribution. Key mathematical concepts include normal distribution and statistics. Using GeoGebra commands such as Point, Normal, and Integral, the normal distribution curve is constructed, and the probability of a specified interval is calculated. Suitable for high school and above students or teachers.
GeoGebra Commands & Parameters
Point(xAxis) → BPoint(xAxis) → ANormal(μ, σ, x, false) → fIntegral(f, x_{A}, x_{B}) → aPoint({(x_{A}, f(x_{A}))}) → f_{A}Point({(x_{B}, f(x_{B}))}) → f_{B}Integral(f, -Infinity, x_{A}) → bIntegral(f, x_{B}, Infinity) → c
AI Drawing Prompt Reference
Draw a normal distribution curve on a coordinate plane. Place two points on the x-axis, and mark their corresponding points on the curve. Shade the area under the curve between these two x-values to represent the probability of that interval. Also shade the left tail (from negative infinity to the left x-value) and the right tail (from the right x-value to positive infinity) to show the probabilities of those regions. Label the shaded areas with their probability values. The graph should clearly illustrate the concept of probability calculation for a normal distribution.
The prompt above was compiled from the original drawing commands and is for reference only.