
Normal Distribution Demo by ngboonleong
Loading the math board and drawing, please wait…
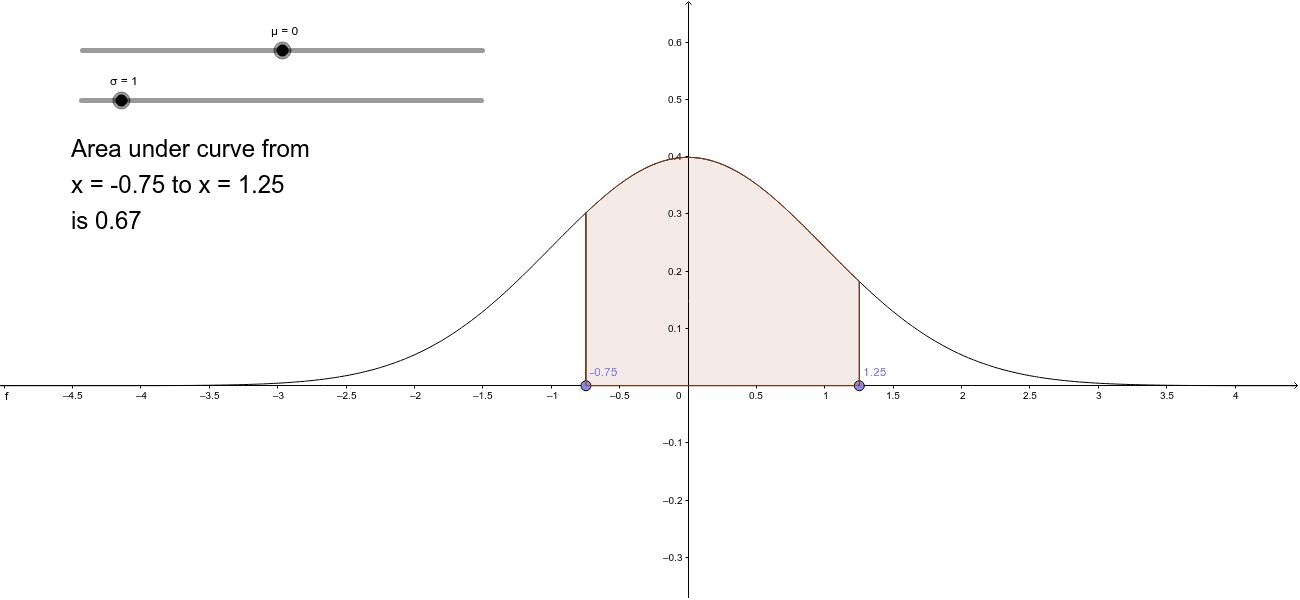
This example demonstrates the probability density function of the normal distribution along with its geometric properties. Key math concepts include normal distribution, mean (μ), standard deviation (σ), integral calculation, and frequency distribution. GeoGebra commands like Point, OrthogonalLine, Intersect, Segment, and Integral are used to plot the function, mean line, standard deviation intervals, and integral areas. Suitable for high school students and beginners in statistics.
GeoGebra Commands & Parameters
Point(xAxis) → APoint(xAxis) → BOrthogonalLine(A, xAxis) → aOrthogonalLine(B, xAxis) → bIntersect(f, a, (-0.7460869565217395, 0.30202019090203536)) → CIntersect(f, b, (1.252173913043479, 0.1821529996835739)) → DSegment(A, C) → cSegment(B, D) → dIntegral(f, xa, xb) → area
AI Drawing Prompt Reference
Draw the probability density function of a normal distribution, mark the mean line and two standard deviation intervals, connect the function to the mean line at specific points with line segments, and calculate and display the integral area of one standard deviation interval.
The prompt above was compiled from the original drawing commands and is for reference only.