
Normal Curve Area Demonstration
Loading the math board and drawing, please wait…
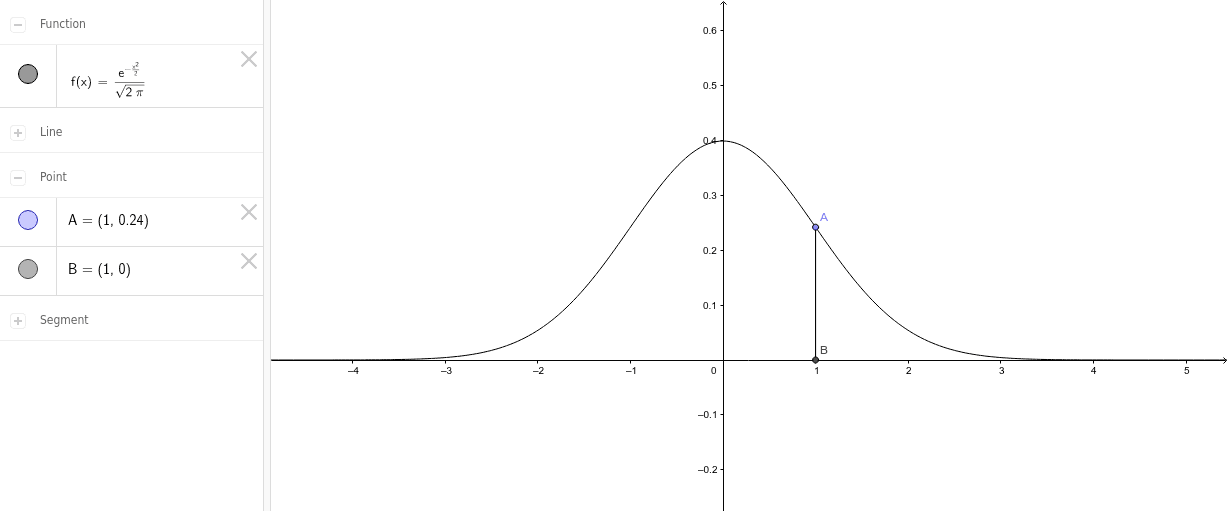
This example demonstrates how to move a vertical line along a normal curve by dragging a point, visually representing the change in the area under the curve. Key math concepts include normal distribution, probability & statistics, and integral applications. It uses GeoGebra commands like Point, OrthogonalLine, Intersect, and Segment. Suitable for high school students and statisticians to understand normal distribution properties and area calculations.
GeoGebra Commands & Parameters
Point(f) → AOrthogonalLine(A, xAxis) → aIntersect(a, xAxis) → BSegment(A, B) → b
AI Drawing Prompt Reference
Draw a normal distribution curve and move a vertical line along it by dragging a point to visually represent the change in the area under the curve. First, draw the vertical line, then find its intersection with the x-axis, and finally connect these two points to form a segment, illustrating the area change process.
The prompt above was compiled from the original drawing commands and is for reference only.