
NCERT Exercise 14.3 Q1: Bar Chart and Statistical Visualization
Loading the math board and drawing, please wait…
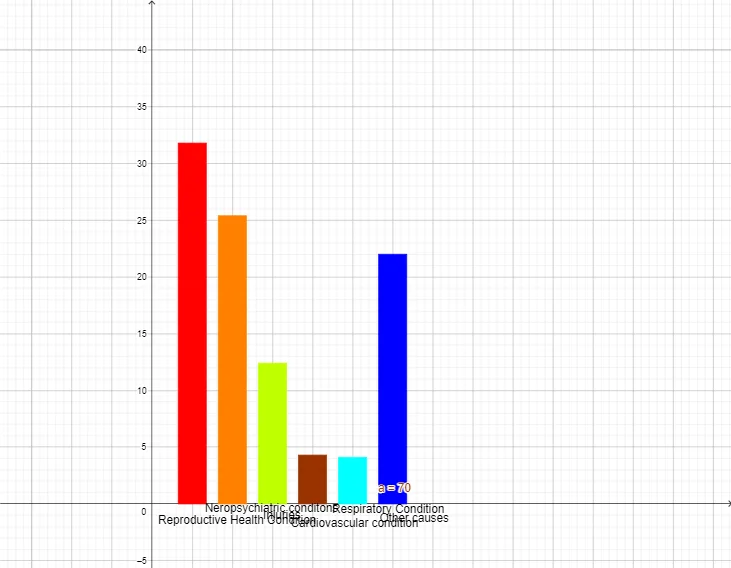
This GeoGebra example demonstrates how to construct a statistical bar chart (or bar graph) using the BarChart command, based on frequency distribution data from NCERT Exercise 14.3 Question 1. The core mathematical concepts involve statistics, frequency distribution, and data visualization through bar charts. The construction uses the BarChart command to generate the main graphical representation, along with multiple text objects (text1 through text6) to label the chart, axes, or data points, and an object 'a' likely storing the data or chart reference. This resource is suitable for middle school students (around grades 8-9) studying statistics, particularly those following the NCERT curriculum. It helps learners visually interpret frequency tables, understand how bar heights correspond to frequencies, and practice creating and reading statistical graphs, thereby reinforcing data analysis skills.
GeoGebra Commands & Parameters
BarChart({1, 2, 3, 4, 5, 6}, {31.8, 25.4, 12.4, 4.3, 4.1, 22}, 0.7) → a
AI Drawing Prompt Reference
Create a statistical bar chart showing categories 1 through 6 on the horizontal axis, with corresponding values 31.8, 25.4, 12.4, 4.3, 4.1, and 22. Represent each value by the height of its bar, and use a clear separation between bars with an approximate bar width of 0.7. Make the bar heights the main focus for visualizing the frequency distribution, with space available for adding basic text labels such as a title or axis notes if needed.
The prompt above was compiled from the original drawing commands and is for reference only.