
Museum Ticket Price Data Analysis Example
Loading the math board and drawing, please wait…
In collections
CCSS Support Algebra I Unit 3
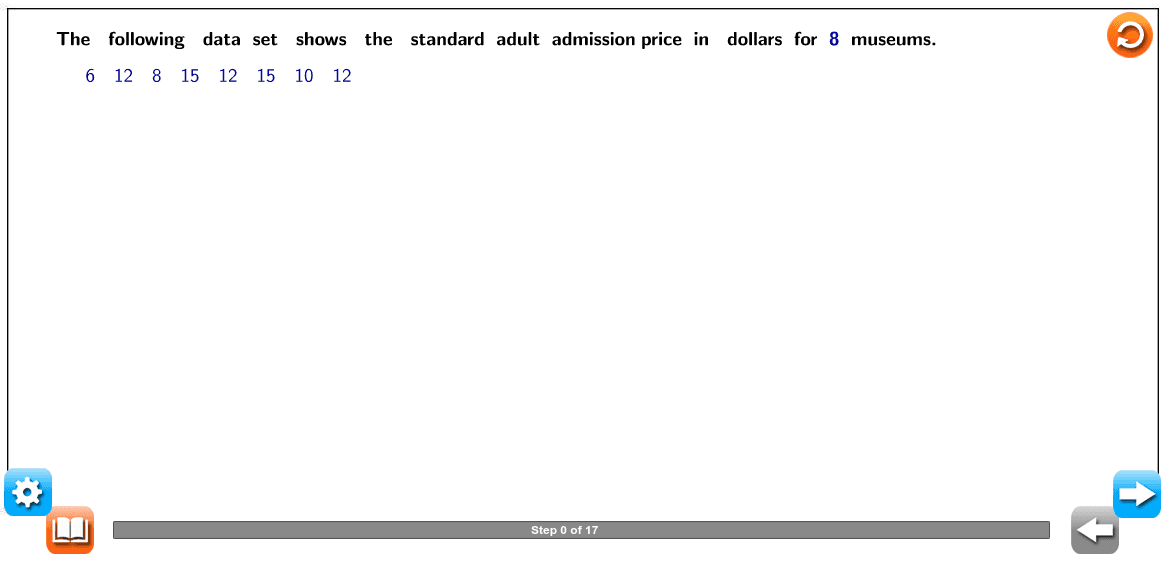
This example demonstrates how to calculate the mean absolute deviation from a dataset of standard adult admission prices for 8 museums. Key mathematical concepts include statistical analysis and error measurement. Construction involves using GeoGebra commands like Mean, Sum, and Intersect to process the data. Suitable for middle school students learning statistics or high school students for data analysis practice.
GeoGebra Commands & Parameters
Mean({val1, val2, val3, val4, val5, val6, val7, val8}) → meanLaTeX("\text{Use the buttons below to return to the original problem or}") → RandomTextLaTeX("\text{randomly generate a similar practice problem.}") → RandomText1Sum({mod1, mod2, mod3, mod4, mod5, mod6, mod7, mod8}) → modsumLaTeX("\text{Calculate the mean.}") → text1LaTeX((((("\text{\textcolor{#000099}{=\frac{" * sum) * "}{") * total) * "}}}")) → text5LaTeX((("\text{\textcolor{#000099}{=" * mean) * "}}")) → text6LaTeX((("\text{The mean of the data set is \textcolor{#000099}{" * mean) * "}.}")) → text7LaTeX("\text{Find the absolute value of the differences between each value and the mean.}") → text8LaTeX("\text{of these differences.}") → text10LaTeX("\text{Find the average of the differences.}") → text19LaTeX((((((((((((((((((("\text{\textcolor{#000099}{\frac{" * mod1) * "+") * mod2) * "+") * mod3) * "+") * mod4) * "+") * mod5) * "+") * mod6) * "+") * mod7) * "+") * mod8) * "}{") * total) * "}}}")) → text22LaTeX((((("\text{\textcolor{#000099}{=\frac{" * modsum) * "}{") * total) * "}}}")) → text23LaTeX((("\text{\textcolor{#000099}{=" * average) * "}}")) → text24LaTeX((("\text{The average of the differences is \textcolor{#000099}{" * average) * "}.}")) → text25LaTeX("\text{State the mean absolute deviation and explain what it means.}") → text26LaTeX("\text{Move the slider to solve the problem.}") → SliderTextIntersect(c, g) → PopupAIntersect(c, f) → PopupBIntersect(d, f) → PopupCIntersect(d, g) → PopupDLaTeX((((((("\text{ \textcolor{#000099}{|" * val1) * "-") * mean) * "|=") * mod1) * "}")) → text11LaTeX((((((("\text{ \textcolor{#000099}{|" * val2) * "-") * mean) * "|=") * mod2) * "}")) → text12LaTeX((((((("\text{ \textcolor{#000099}{|" * val3) * "-") * mean) * "|=") * mod3) * "}")) → text13LaTeX((((((("\text{ \textcolor{#000099}{|" * val4) * "-") * mean) * "|=") * mod4) * "}")) → text14LaTeX((((((("\text{ \textcolor{#000099}{|" * val5) * "-") * mean) * "|=") * mod5) * "}")) → text15LaTeX((((((("\text{ \textcolor{#000099}{|" * val6) * "-") * mean) * "|=") * mod6) * "}")) → text16LaTeX((((((("\text{ \textcolor{#000099}{|" * val7) * "-") * mean) * "|=") * mod7) * "}")) → text17LaTeX((((((("\text{ \textcolor{#000099}{|" * val8) * "-") * mean) * "|=") * mod8) * "}")) → text18LaTeX((((((((((((((((((("\text{\textcolor{#000099}{\frac{" * val1) * "+") * val2) * "+") * val3) * "+") * val4) * "+") * val5) * "+") * val6) * "+") * val7) * "+") * val8) * "}{") * total) * "}}}")) → text4TableText({{LaTeX[(("\text{\textcolor{#000099}{" * val1) * "}}")], LaTeX[(("\text{\textcolor{#000099}{" * val2) * "}}")], LaTeX[(("\text{\textcolor{#000099}{" * val3) * "}}")], LaTeX[(("\text{\textcolor{#000099}{" * val4) * "}}")], LaTeX[(("\text{\textcolor{#000099}{" * val5) * "}}")], LaTeX[(("\text{\textcolor{#000099}{" * val6) * "}}")], LaTeX[(("\text{\textcolor{#000099}{" * val7) * "}}")], LaTeX[(("\text{\textcolor{#000099}{" * val8) * "}}")]}}) → QuestionText1LaTeX("\text{WORDS TO KNOW}") → text33LaTeX("\text{DATA KIT}") → text32LaTeX((("\text{" * val2) * "}")) → text35LaTeX((("\text{" * val3) * "}")) → text36LaTeX((("\text{" * val4) * "}")) → text37LaTeX((("\text{" * val6) * "}")) → text39LaTeX((("\text{" * val7) * "}")) → text40LaTeX((("\text{" * val8) * "}")) → text41LaTeX((("\text{" * val1) * "}")) → text34LaTeX((("\text{" * val5) * "}")) → text38LaTeX("\text{To calculate the mean,find the sum of the values and divide by the total number of }") → text2LaTeX((("\text{\mathbf{The \; following \; data \;set \; shows \; the \; standard\; adult\; admission\;price\; in \; dollars\; for\; \textcolor{#000099}{" * total) * "}\; museums. }}")) → QuestionTextLaTeX("\text{To find the average, add all of the differences and divide by the number of data}") → text20LaTeX((("\text{points, \textcolor{#000099}{" * total) * "}.}")) → text21LaTeX((("\text{Subtract the mean, \textcolor{#000099}{" * mean) * "}, from each value in the data set, and take the absolute values}")) → text9LaTeX((("\text{values, \textcolor{#000099}{" * total) * "}.}")) → text3LaTeX((("\text{The mean absolute deviation is the average of the differences, \textcolor{#000099}{" * average) * "}.This means that }")) → text27LaTeX((("\text{admission prices in this city are, on average, about \textcolor{#000099}{\textdollar" * average) * "} from the mean museum price.}")) → text28LaTeX("\text{\mathbf{mean} the average value of a data set, found by summing all values and dividing") → Hint_headingLaTeX("\text{by the number of data points }") → HintLaTeX("\text{\mathbf{absolute \;value} a number’s distance from \textcolor{#000099}{0} on a number line; the positive value}") → text42LaTeX("\text{of a quantity}") → text43
AI Drawing Prompt Reference
Input the standard adult admission prices for 8 museums, then calculate and display the mean, the absolute differences between each price and the mean, and the average of these differences. Finally, explain the mean absolute deviation.
The prompt above was compiled from the original drawing commands and is for reference only.