
Multivariate Limits Example 2: Visualizing Path-Dependent Approach
Loading the math board and drawing, please wait…
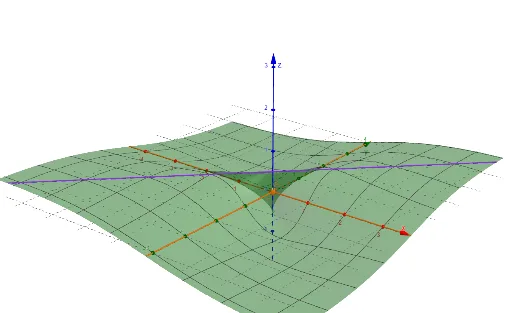
This GeoGebra example demonstrates the concept of limits for multivariate functions by visualizing a surface and multiple parametric curves approaching a target point. It highlights how the limit value can depend on the chosen path, a key subtlety in multivariable calculus. The construction uses the CurveCartesian command to define parametric curves, along with objects such as f, a, A, b, c, B, C, and d to control the surface, paths, and the point of approach. Users can manipulate sliders or dynamic points to see how different paths yield different limiting values, reinforcing the definition of a limit in higher dimensions. This resource is ideal for university-level calculus courses, serving as a visual aid for lectures or as an interactive tool for students to explore path-dependent limits and the non-uniqueness of limits when they do not exist.
GeoGebra Commands & Parameters
CurveCartesian(0, t, 0, t, -5, 5) → aCurveCartesian(t, 0, 0, t, -5, 5) → bCurveCartesian(t, t, 1 / 2, t, -5, 5) → cCurveCartesian(t, (-t), -1 / 2, t, -5, 5) → d
AI Drawing Prompt Reference
Visualize a 3D surface with three parametric curves approaching a point on the surface from different paths to illustrate the concept of multivariate limits. One curve moves along the x-axis, another along the y-axis, and the remaining two along the diagonals y=x and y=-x, demonstrating how the limit depends on the chosen path by showing different limiting values.
The prompt above was compiled from the original drawing commands and is for reference only.