
Multi-step Experiments: Interactive Hypergeometric Distribution and Hypothesis T
Loading the math board and drawing, please wait…
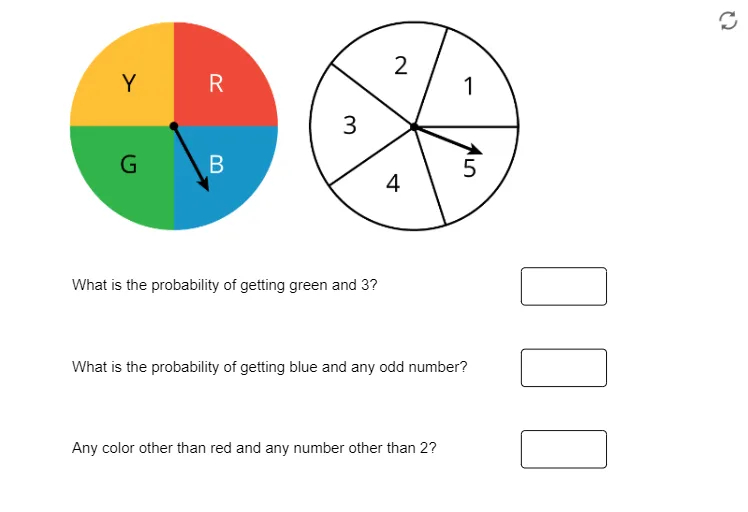
This example dynamically demonstrates multi-step experiments, illustrating hypergeometric distribution, hypothesis testing, and pie chart visualization. Users can input parameters via text fields and input boxes to observe probability changes under different conditions. Core mathematical concepts include sequences and series, probability and statistics, hypothesis testing, and data graphing. It is suitable for high school and introductory college statistics courses, helping students understand the analysis of multi-step random experiments.
GeoGebra Commands & Parameters
Textfield(f) → InputBox1Textfield(g) → InputBox2Textfield(h) → InputBox3
AI Drawing Prompt Reference
Create an interactive chart to demonstrate the hypergeometric distribution and hypothesis testing in multi-step experiments. Users can input parameters f, g, and h via text fields to change probabilities and observe probability changes under different conditions. The chart includes a pie chart showing the probability distribution of experimental results and a text box displaying the results of hypothesis testing.
The prompt above was compiled from the original drawing commands and is for reference only.