
More Graphing Inequalities
Loading the math board and drawing, please wait…
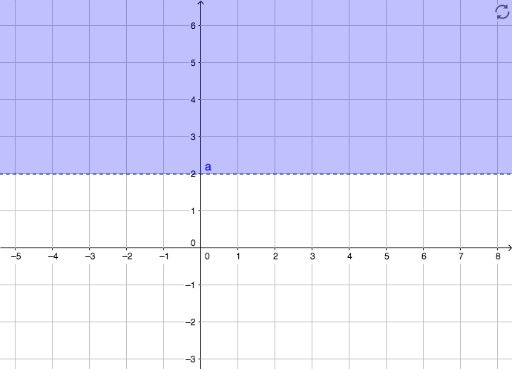
This example demonstrates how to graph inequalities in a coordinate system and observe their solution sets. The core math concepts involved include inequalities, line segments, triangles, straight lines, and hyperbolas. Construction highlights involve using GeoGebra's object 'a' to build the graph, with slider animations showing the changes in inequality solution sets. Suitable for high school students learning about coordinate geometry and inequalities.
GeoGebra Commands & Parameters
a(y) = y > 2
AI Drawing Prompt Reference
Draw a coordinate system and graph the inequality y > 2. Start by drawing the line y = 2, then shade the region where y > 2. Observe how the line and shaded area change to understand the solution set of the inequality.
The prompt above was compiled from the original drawing commands and is for reference only.