
Monopoly Minimum Wages Model
Loading the math board and drawing, please wait…
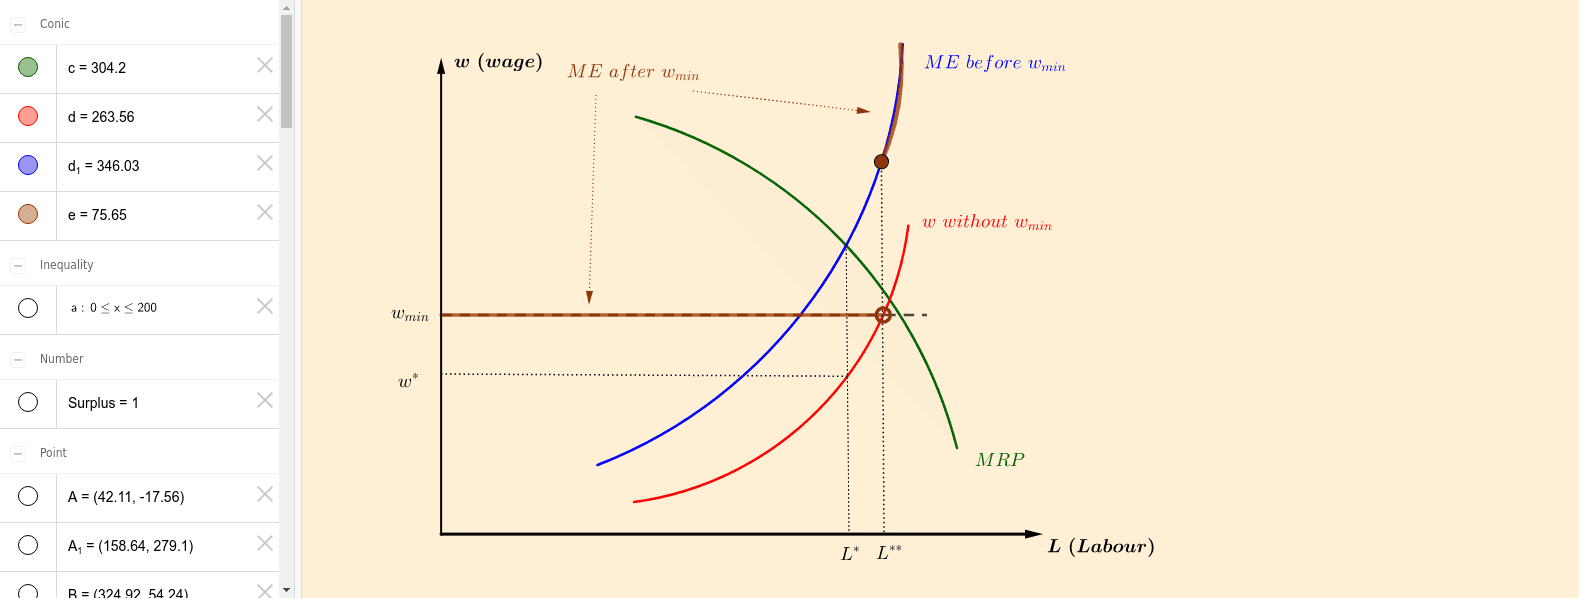
This example demonstrates the impact of minimum wages on labor market supply and demand relationships in a monopsony. Key math concepts include supply and demand curves, marginal revenue, optimal employment quantity, and social welfare loss. GeoGebra commands like Point, Vector, CircleArc, Intersect, and Segment are used to construct key points and curves, determining equilibrium points with Intersect, and representing wage lines and demand curves with Segment. Suitable for high school and above students/researchers in economics and calculus to understand market structures and policy effects.
GeoGebra Commands & Parameters
Point(yAxis) → GPoint(xAxis) → HVector(G, H) → uPoint(u) → IPoint(yAxis) → JVector(I, J) → vCircleArc(A, B, C) → cCircleArc(D, E, F) → dCircleArc(D_1, E_1, F_1) → d_1Point(v) → LIntersect(c, d_1, 1) → MPoint(u) → NSegment(M, N) → gPoint(v) → OSegment(O, P) → hPoint(h) → QIntersect(d, h, 1) → RSegment(Q, R) → iPoint(d_1) → SPoint(u) → TSegment(S, T) → jPoint(d_1) → VCircleArc(U, S, V) → eIntersect(d, g, 1) → WSegment(W, L) → fVector(K, Z) → wVector(A_1, B_1) → b