
Modified Boxplot
Loading the math board and drawing, please wait…
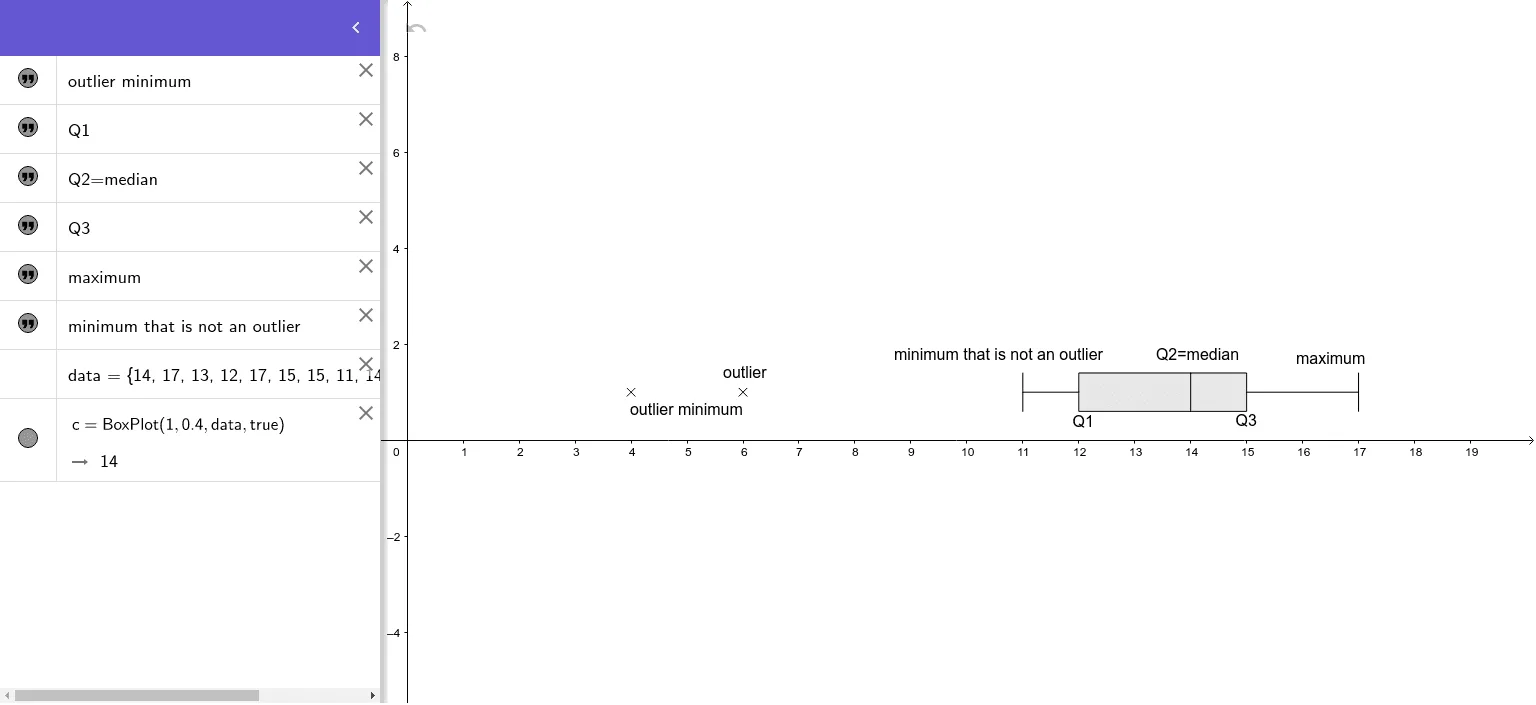
This example demonstrates a modified boxplot, showing the distribution of data. Key mathematical concepts include the basic structure of a boxplot, quartiles, median, and outliers. Using the GeoGebra command BoxPlot, the distribution characteristics of the data can be intuitively displayed. Suitable for statistics education and data analysis learning.
GeoGebra Commands & Parameters
BoxPlot(1, 0.4, data, true) → c