
Model the Golden Gate Bridge
Loading the math board and drawing, please wait…
In collections
Explore the Graphs of Quadratic Functions
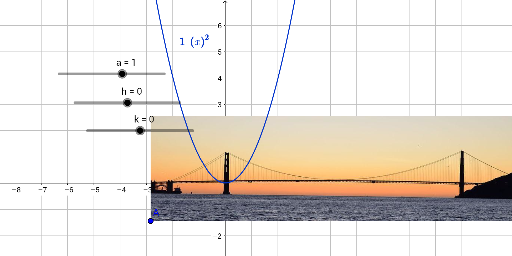
This example demonstrates how to construct a mathematical model of the Golden Gate Bridge using GeoGebra. It involves core math concepts like arithmetic, random variables, variance, geometric distribution, and linear programming. Key GeoGebra commands/objects used include a (length), h (height), k (scale), c (constant), A (point), B (point), and pic1 (picture). Suitable for high school and above students to understand mathematical modeling of real-world structures.
GeoGebra Commands & Parameters
Numeric a(1)Numeric h(0)Numeric k(0)c(x) = (a * (x - h)^(2)) + kPoint A(-2.848, -1.448)Point B(11.3072, -1.448)
AI Drawing Prompt Reference
Create a mathematical model of the Golden Gate Bridge. Start by setting length a to 1, height h to 0, and scale k to 0. Use the formula c(x) = a * (x - h)^2 + k to generate the curve. Place points A and B at coordinates (-2.848, -1.448) and (11.3072, -1.448) respectively, representing the bridge towers. Finally, use these points and the curve to construct the bridge's shape.
The prompt above was compiled from the original drawing commands and is for reference only.