
Mobile Phone Numbers Comparison: Norway vs. India
Loading the math board and drawing, please wait…
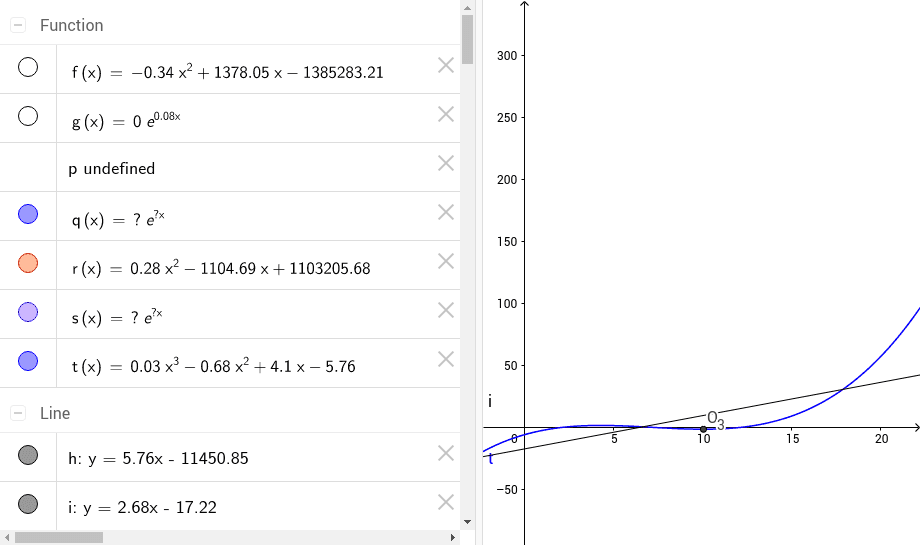
This example compares the number of mobile phone users in Norway and India. Key mathematical concepts include data fitting and correlation analysis. Using GeoGebra commands such as FitPoly, FitExp, FitLineY, FitSin, and Min, the trends in the data can be visually observed and analyzed. Suitable for high school mathematics education and data analysis learning.
GeoGebra Commands & Parameters
FitPoly(list1, 2) → fRSquare(list1, f) → aFitExp(list1) → gFitLineY(list1) → hFitSin(list1) → pRSquare(list1, h) → bFitExp(list2) → qFitPoly(list2, 2) → rRSquare(list2, r) → cFitExp(list4) → sFitLineY(list4) → iFitPoly(list4, 3) → tRSquare(list4, t) → dMin(t, 5, 15) → M_3Min(t, 4, 15) → N_3Min(t, 5, 15) → O_3
AI Drawing Prompt Reference
Create a comparison chart of mobile phone users in Norway and India, displaying polynomial, exponential, and sine function fitting curves, along with linear fitting lines, and label the R-squared values for each fit, start by plotting data points and basic fitting curves, then add statistical indicators and minimum value markers.
The prompt above was compiled from the original drawing commands and is for reference only.