
Missouri COVID-19 Growth Model
Loading the math board and drawing, please wait…
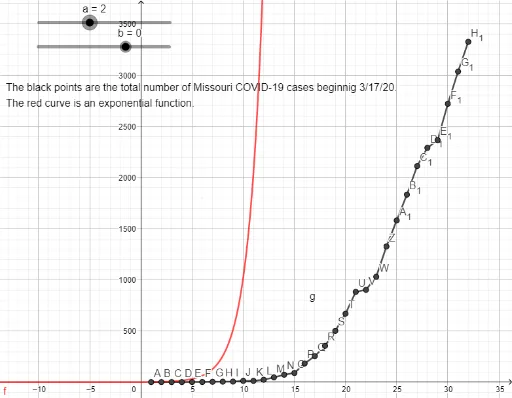
This example demonstrates the growth curve of COVID-19 cases in Missouri, visualizing exponential growth patterns. Key math concepts include exponential functions, tangent lines, linear functions, difference and slope, and coordinate geometry. Construction highlights involve using the PolyLine command to draw connected data points with objects like a, b, f, A1-B19, showcasing geometric representations of real-world data trends. Suitable for high school and above, focusing on practical applications of exponential functions.
GeoGebra Commands & Parameters
PolyLine({A, B, C, D, E, F, G, H, I, J, K, L, M, N, O, P, Q, R, S, T, U, V, W, Z, A_1, B_1, C_1, D_1, E_1, F_1, G_1, H_1}) → g