
Minion Symmetry and Parametric Statistics Demo
Loading the math board and drawing, please wait…
In collections
Lines of Symmetry in Two-Dimensional Shapes and Images
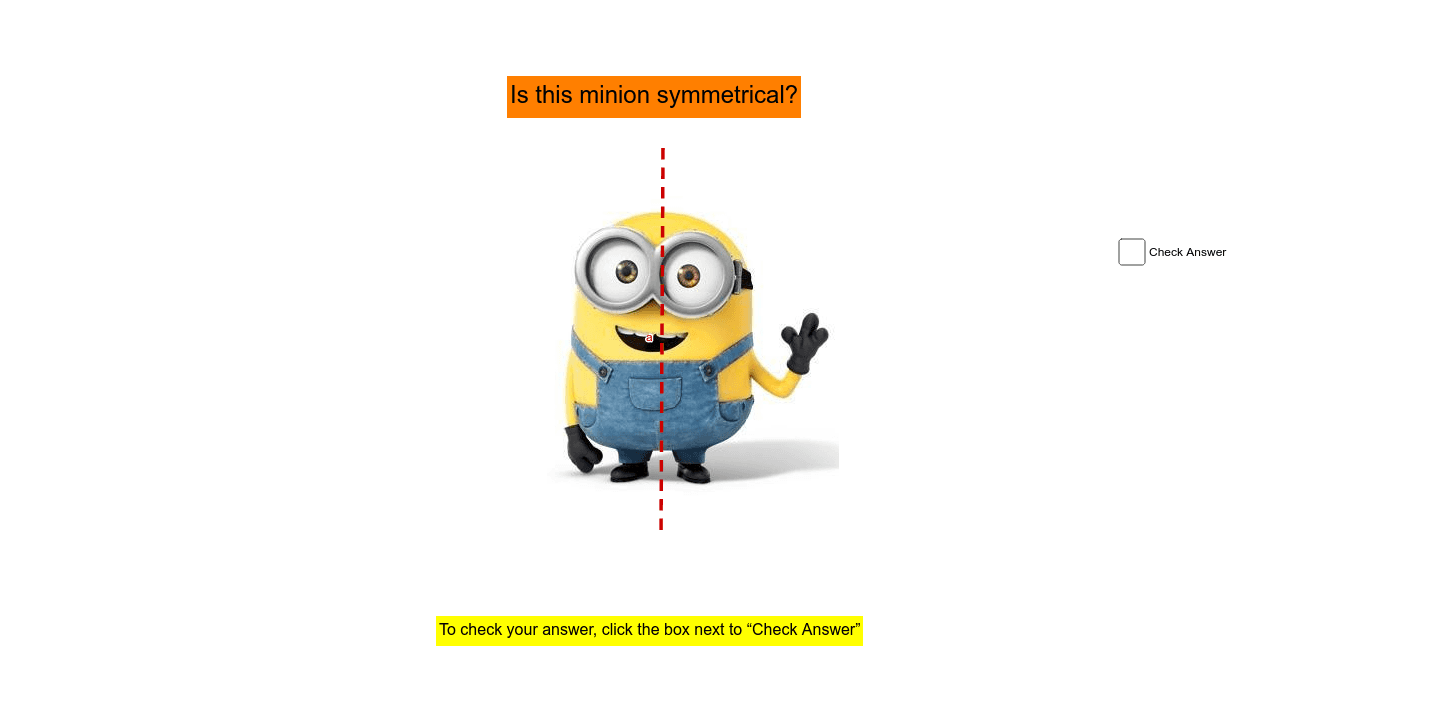
This GeoGebra example creates a playful 'Minion' figure to demonstrate symmetry, parametric curves, and statistical distributions (binomial and geometric) along with median values. The core mathematical concepts include symmetry transformations, parametric equations, probability distributions (binomial and geometric), and the geometric interpretation of mean and median. Construction highlights: the Segment command is used to build line segments, with objects A, B, C, D as key points, pic1 as an embedded image, a and b as parameters or sliders, and text1-text4 as labels for annotations or statistical values. Suitable for upper secondary to early university students, this example merges probability and statistics with geometric construction, enhancing intuitive understanding of distribution shapes and symmetry. It is ideal for math lab activities or engaging math demonstrations.
GeoGebra Commands & Parameters
Segment(C, D) → a
AI Drawing Prompt Reference
Draw a playful 'Minion' figure to demonstrate symmetry, including parametric curves and statistical distributions (binomial and geometric) with median values. Use line segments to construct the figure, adjust parameters with sliders, embed a Minion image, and label key points and statistical values, suitable for upper secondary to early university students to understand distribution shapes and symmetry.
The prompt above was compiled from the original drawing commands and is for reference only.