
Mean, Median, Mode, Range Demo
Loading the math board and drawing, please wait…
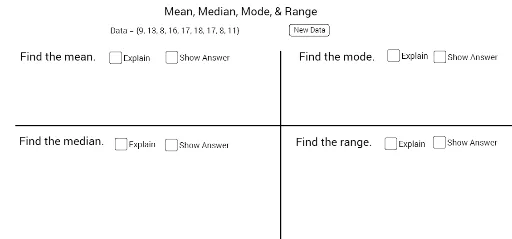
This example dynamically demonstrates a set of random data, clearly showing the concepts and calculations of mean, median, mode, and range; Core math concepts include data statistics, measures of central tendency and dispersion, sorting, and filtering; Construction highlights: uses GeoGebra commands like Random for generating random numbers, Sort and RandomElement for sorting and selecting elements, Max and Min for determining extrema, CountIf for mode counting, and Median for median calculation, combined with objects like Segment for visualizing data distribution; Suitable for middle school and above mathematics teaching, for introductory probability statistics and data analysis skill development.
GeoGebra Commands & Parameters
Random(Low, High) → JRandom(Low, High) → IRandom(Low, High) → HRandom(Low, High) → GRandom(Low, High) → FRandom(Low, High) → ERandom(Low, High) → DRandom(Low, High) → CRandom(Low, High) → BRandom(Low, High) → ASort({A, B, C, D, E, F}) → sL_6Sort({A, B, C, D, E, F, G}) → sL_7Sort({A, B, C, D, E, F, G, H, I, J}) → sL_8Sort({A, B, C, D, E, F, G, H, I}) → sL_9Sort({A, B, C, D, E, F, G, H, I, J}) → sL_5RandomElement({L_6, L_7, L_8, L_9, L_5}) → FinalMax(Final) → HighestNumberMedian(Final) → MedianSort(Final) → SortFinalMin(Final) → LowestNumCountIf(x > -1, Final) → ElemsElement(SortFinal, 1) → A_sElement(SortFinal, 2) → B_sElement(SortFinal, 3) → C_sElement(SortFinal, 4) → D_sElement(SortFinal, 5) → E_sElement(SortFinal, 6) → F_sElement(SortFinal, 7) → G_sElement(SortFinal, 8) → H_sElement(SortFinal, 9) → I_sElement(SortFinal, 10) → J_sSegment(K, L) → lSegment(M, N) → m
AI Drawing Prompt Reference
Create a dynamic visualization showing randomly generated data points, display these values as bar charts in different colors and shapes to illustrate their distribution, and calculate and display the mean, median, mode, and range of the data, connecting the data points with line segments to visually demonstrate data distribution and statistical concepts.
The prompt above was compiled from the original drawing commands and is for reference only.