
Mean, Median, and Mode
Loading the math board and drawing, please wait…
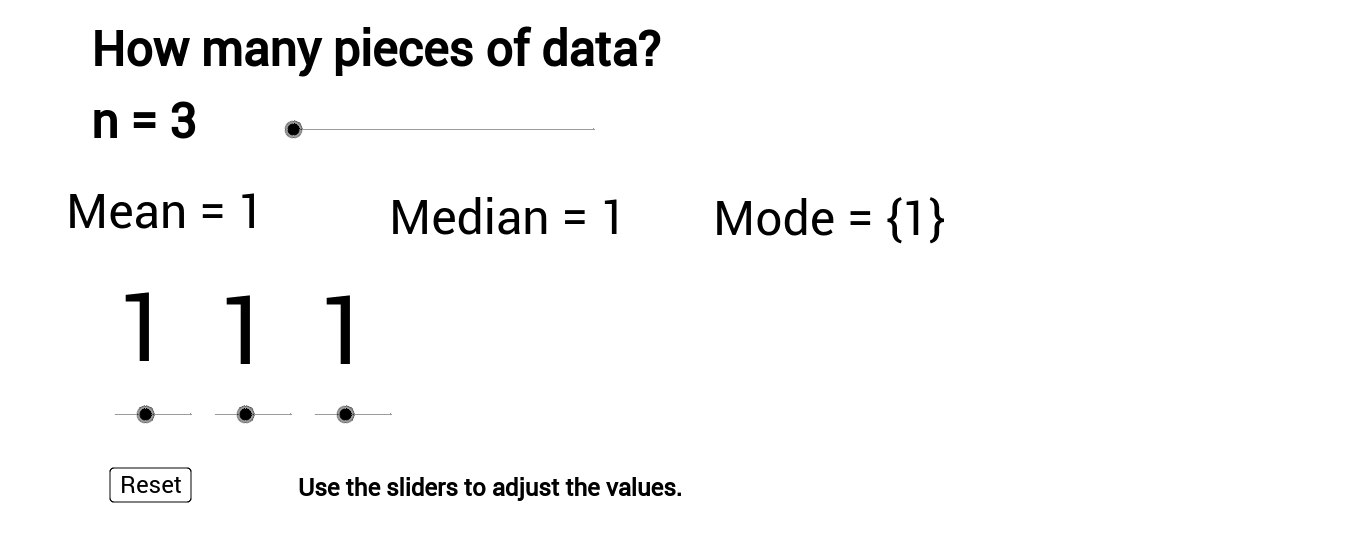
This example dynamically demonstrates the changes in mean, median, and mode by adjusting the number and values of data points. Key mathematical concepts include arithmetic mean, median, and mode. GeoGebra commands used include Mean, Median, and Mode. Suitable for students in middle school and above to learn statistics.
GeoGebra Commands & Parameters
Mean(A1:A3) → C3Mean(A1:A4) → C4Mean(A1:A5) → C5Mean(A1:A6) → C6Mean(A1:A7) → C7Mean(A1:A8) → C8Median($A$1:A3) → D3Median($A$1:A4) → D4Median($A$1:A5) → D5Median($A$1:A6) → D6Median($A$1:A7) → D7Median($A$1:A8) → D8Mode($A$1:A3) → E3Mode($A$1:A4) → E4Mode($A$1:A5) → E5Mode($A$1:A6) → E6Mode($A$1:A7) → E7Mode($A$1:A8) → E8Element(av, n - 2, 1) → mean1Element(av, n - 2, 2) → median1Element(av, n - 2, 3) → mode1
AI Drawing Prompt Reference
Create a set of data points and dynamically show the changes in arithmetic mean, median, and mode by adjusting the number and values of the data points. First, create 8 data points, then calculate and display the mean, median, and mode of these 8 points, and observe how they change with the data points.
The prompt above was compiled from the original drawing commands and is for reference only.