
Mean and Mode in Geometry
Loading the math board and drawing, please wait…
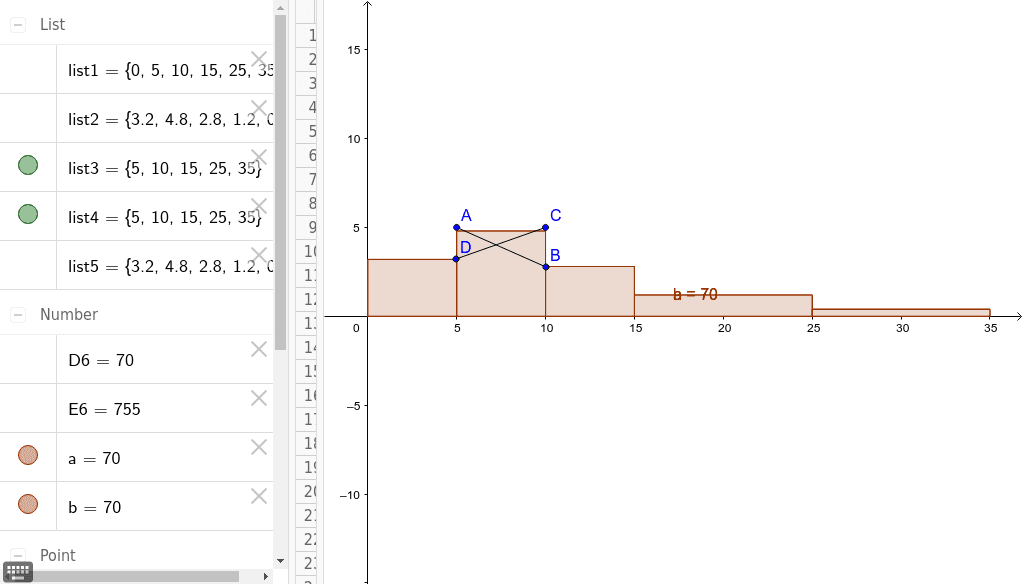
This example demonstrates the calculation and comparison of mean and mode using GeoGebra. Key mathematical concepts include statistics, mean, median, and data distribution visualization. Construction involves Sum for total calculation, Histogram for frequency distribution, and Segment for plotting data points. Suitable for middle school students learning statistics or for math teaching on data analysis.
GeoGebra Commands & Parameters
Sum(D1:D5) → D6Sum(E1:E5) → E6Histogram(list1, list2) → aHistogram(list1, list2) → bSegment(A, B) → cSegment(D, C) → d
AI Drawing Prompt Reference
Draw a triangle and plot a set of data points inside it. Create a histogram to show the data distribution using these points, and calculate and display the sum of these points.
The prompt above was compiled from the original drawing commands and is for reference only.