
Logarithmic Functions Graphs by Anuchit
Loading the math board and drawing, please wait…
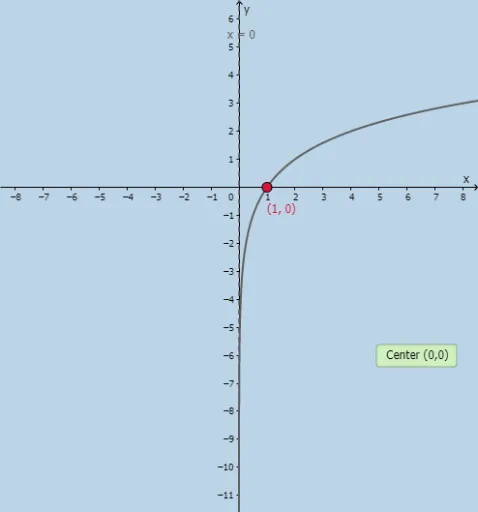
This example demonstrates the graphical representation of logarithmic functions and their applications in mathematics. The core concepts involve logarithmic definitions, function properties, and relationships with exponential functions. Construction involves using GeoGebra commands such as Textfield, InputBox, and Slider to create logarithmic function graphs and adjust parameters to observe changes. Suitable for high school students or college undergraduates learning function graphs and calculus fundamentals.
GeoGebra Commands & Parameters
Textfield(a) → InputBox1Textfield(c) → InputBox2Textfield(k) → InputBox3Textfield(d) → InputBox5