
Logarithmic Functions and Scatter Plots
Loading the math board and drawing, please wait…
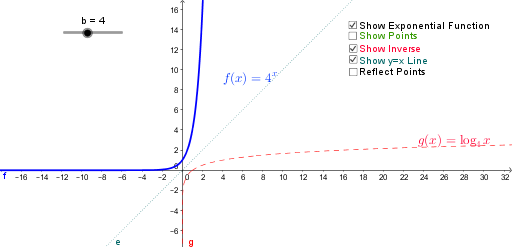
This example demonstrates the plotting of logarithmic functions and their corresponding scatter plots, highlighting variations and properties. Core mathematical concepts include logarithmic functions, scatter plots, differential equations, natural numbers, and inequalities. The construction utilizes GeoGebra commands and objects such as Point, b, g, f, A, B, C, D, E, F, d, e, h, E', D', C', F', i, text2, c, a, text1. Suitable for high school and above students to understand logarithmic function characteristics and data analysis.
GeoGebra Commands & Parameters
Point(f) → A