
Local Linearity and Tangent Lines
Loading the math board and drawing, please wait…
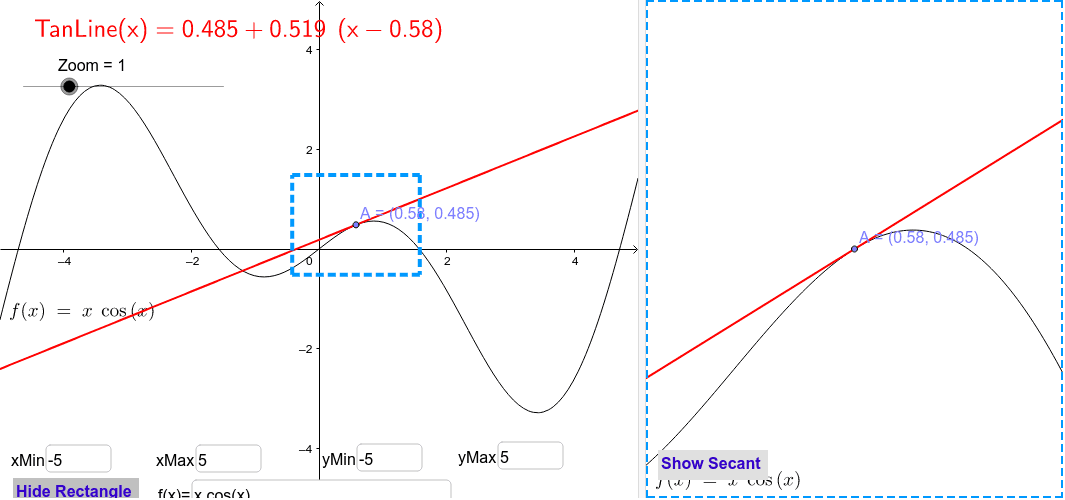
This example illustrates the concept of local linearity and tangent lines. Key mathematical concepts include the local linearity property of functions and the definition of tangents. The TaylorSeries command is used to construct the tangent line at a specific point. This example covers functions, derivatives, and coordinate geometry, suitable for high school mathematics education.
GeoGebra Commands & Parameters
Point(f) → APolygon(C1, C2, C3, C4) → poly1, c1, c2, c3, c4TaylorSeries(f, x(A), 1) → TanLineTextfield(xMin) → inputBox1Textfield(xMax) → inputBox2Textfield(yMax) → inputBox3Textfield(yMin) → inputBox4Textfield(f) → inputBox5If(togSecant ≟ 1, "Hide Secant ", "Show Secant ") → ShowSecantIf(togR ≟ 1, "Hide Rectangle ", "Show Rectangle ") → RectangleLine(A, AplusH) → SecantLine
AI Drawing Prompt Reference
Draw a function graph to illustrate local linearity and tangents. Set the x-axis range from -5 to 5 and y-axis range from -5 to 5. Choose a point on the x-axis and use Taylor series to generate the tangent line at that point. Draw a polygon to show local linearity. Input the function expression, such as x^2, in the text field. Show or hide the secant line and rectangle based on the input options.
The prompt above was compiled from the original drawing commands and is for reference only.