
Lines & Parabolas
Loading the math board and drawing, please wait…
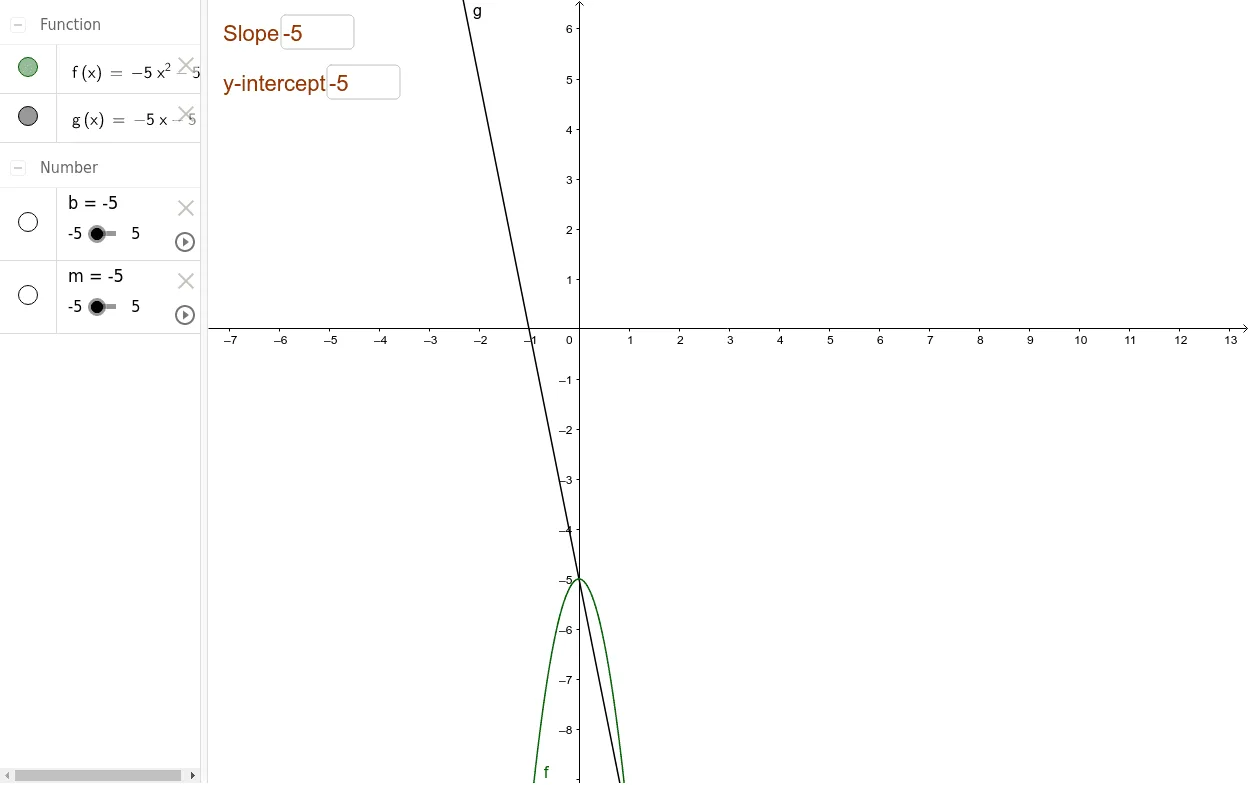
This example demonstrates the geometric relationship between lines and parabolas. Key mathematical concepts include linear equations and parabolic equations. By inputting the slope m and y-intercept b, the linear equation y = mx + b can be constructed; by inputting the parabolic parameters, the parabolic equation y = ax^2 + bx + c can be constructed. GeoGebra commands used include Textfield, objects m, b, InputBox1, InputBox2, g, f, etc. Suitable for high school mathematics education and learning.
GeoGebra Commands & Parameters
Textfield(m) → InputBox1Textfield(b) → InputBox2
AI Drawing Prompt Reference
Graph a line and a parabola to demonstrate their geometric relationship. The line equation is y = mx + b, where m and b are input parameters. The parabola equation is y = ax^2 + bx + c, with a, b, and c also as input parameters. Plot these curves in the coordinate system and label the values of m and b to observe how changes in parameters affect the line and parabola.
The prompt above was compiled from the original drawing commands and is for reference only.