
Linear Regression with One Variable: Interactive Fitting Demonstration
Loading the math board and drawing, please wait…
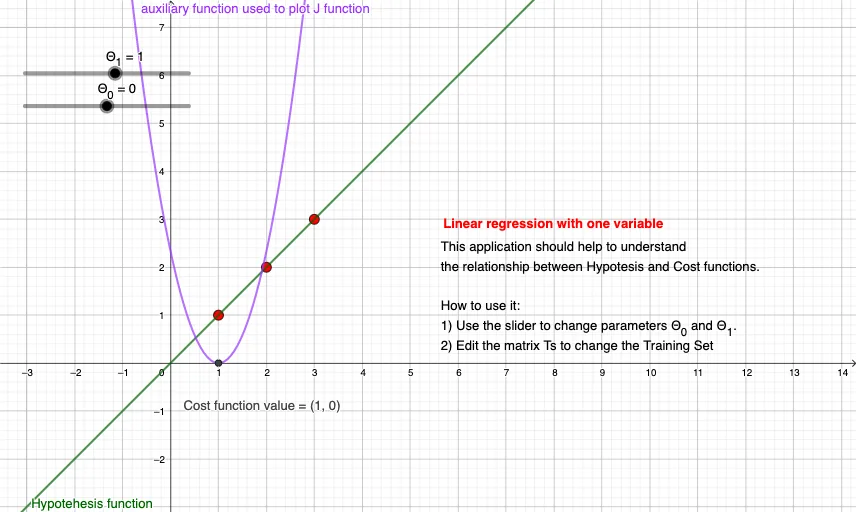
This GeoGebra example demonstrates interactive one-variable linear regression, showing how a regression line fits a set of data points and how the line adjusts as parameters change. Core mathematical concepts include the simple linear regression model y = Θ₀ + Θ₁x, the cost function J (mean squared error), parameter estimation for intercept and slope, and the geometric interpretation of least-squares fitting. The construction uses GeoGebra commands Length, Cell, Point, and PointList, together with objects such as Ts, m, Θ₁, Θ₀, h₀, a, J, b, c, j, E, L₁, L1, testo1, and testo2 to build points, segments, and dynamic text displays. It is suitable for high school statistics, introductory college data analysis, and machine learning preparatory courses, supporting classroom demonstration, inquiry-based learning, and visualization of regression principles.
GeoGebra Commands & Parameters
Length(Ts) → mCell(2, 2) → aCell(2, 2) → bPoint({Θ_1, J(Θ_0, Θ_1)}) → EPointList(Ts) → L_1
AI Drawing Prompt Reference
Draw a graph showing one-variable linear regression. The graph should include a set of random data points, a regression line, an intercept, and a slope, along with a dynamic text display showing the regression equation. The construction order is to first draw the data points, then the regression line, add the intercept and slope, and finally add the text display. The graph should clearly show how data points are fitted by the regression line and how parameters affect the line's position and angle.
The prompt above was compiled from the original drawing commands and is for reference only.