
Linear Regression with Axes
Loading the math board and drawing, please wait…
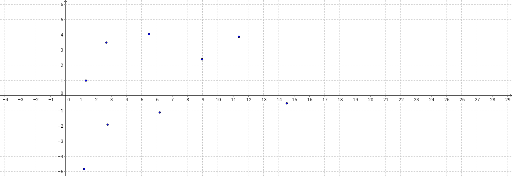
This example demonstrates linear regression. It involves key mathematical concepts such as linear regression, least squares method, and correlation coefficient. Using GeoGebra commands like Line, SumSquaredErrors, FitLineY, etc., a linear regression model can be constructed. Suitable for high school mathematics education and learning.
GeoGebra Commands & Parameters
Line(J, K) → YOURSumSquaredErrors({A, B, C, D, E, F, G, H, I}, YOUR) → SSEYFitLineY({I, H, G, F, E, D, C, B, A}) → BESTSumSquaredErrors({A, B, C, D, E, F, G, H, I}, BEST) → SSEBDistance(B, E) → BEPMCC({A, B, C, D, E, F, G, H, I}) → rSlope(YOUR) → mYOURSlope(BEST) → mBEST
AI Drawing Prompt Reference
Draw a scatter plot with axes, then fit a line using the least squares method, calculate the sum of squared errors, correlation coefficient, and slope. First, draw the axes, then add the points, fit a line to these points, calculate the sum of squared errors, and finally compute the correlation coefficient and slope.
The prompt above was compiled from the original drawing commands and is for reference only.