
Linear Regression & Correlation Demo Worksheet
Loading the math board and drawing, please wait…
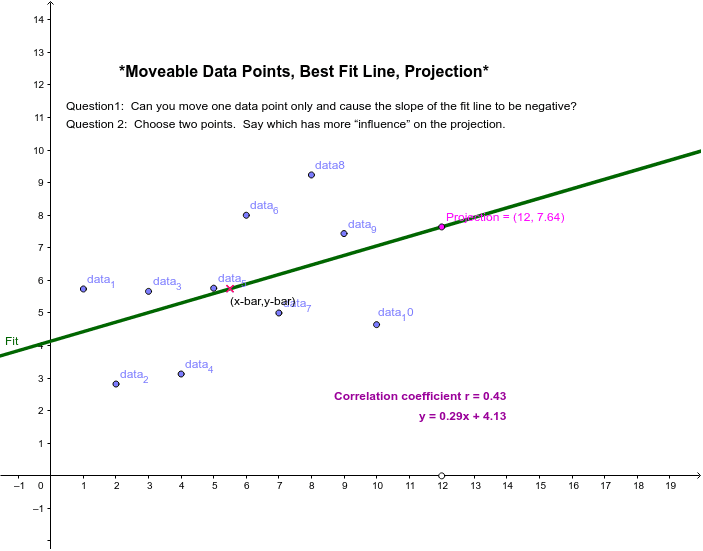
This example demonstrates the calculation and visualization of linear regression and correlation coefficients. Core math concepts include linear regression, correlation coefficient, least squares method, and projection. GeoGebra commands like Point, PMCC, FitLineY, OrthogonalLine, Intersect are used to create data points, fit lines, calculate correlation, and draw perpendiculars. Suitable for high school and above mathematics teaching or introductory statistics learning.
GeoGebra Commands & Parameters
Point(Line[(1, 0), (1, 2)]) → data_1Point(Line[(2, 0), (2, 2)]) → data_2Point(Line[(3, 0), (3, 2)]) → data_3Point(Line[(4, 0), (4, 2)]) → data_4Point(Line[(5, 0), (5, 2)]) → data_5Point(Line[(6, 0), (6, 2)]) → data_6Point(Line[(7, 0), (7, 2)]) → data_7Point(Line[(8, 0), (8, 2)]) → data8Point(Line[(9, 0), (9, 2)]) → data_9Point(Line[(10, 0), (10, 2)]) → data_10PMCC({data_1, data_2, data_3, data_4, data_5, data_6, data_7, data8, data_9, data_10}) → rFitLineY({data_1, data_2, data_3, data_4, data_5, data_6, data_7, data8, data_9, data_10}) → FitPoint(xAxis) → KOrthogonalLine(K, xAxis) → aIntersect(a, Fit) → Projection
AI Drawing Prompt Reference
Draw 10 evenly spaced points along the x-axis from 1 to 10 and y-axis from 0 to 2 in a coordinate system. Calculate and display the linear regression line and correlation coefficient based on these points. Plot a point on the x-axis, draw a perpendicular line from this point to the regression line, and find the foot of the perpendicular. Clearly visualize the linear regression, correlation coefficient, perpendicular, and projection relationships using the graph.
The prompt above was compiled from the original drawing commands and is for reference only.