
Linear Regression Analysis
Loading the math board and drawing, please wait…
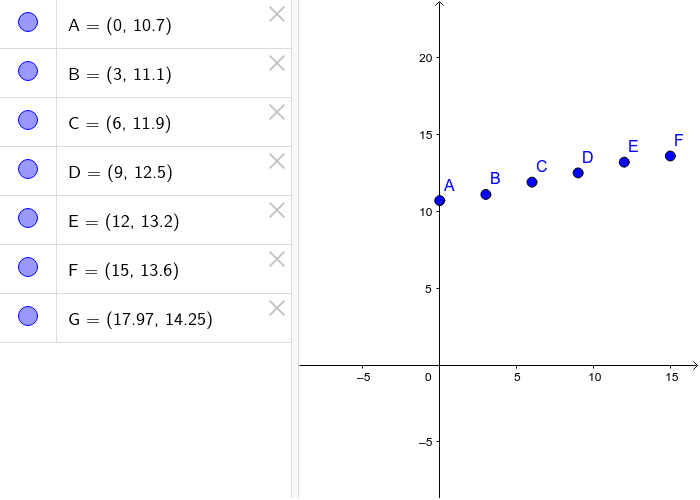
This example demonstrates how to determine the best-fit line for a set of data points through linear regression analysis. Core math concepts include linear regression, line segments, terms, curve sketching, and quadratic equations. Constructed using GeoGebra commands/objects: A, B, C, D, E, F, G. Suitable for high school mathematics teaching or introductory data analysis learning.
GeoGebra Commands & Parameters
A:(0, 10.7)B:(3, 11.1)C:(6, 11.9)D:(9, 12.5)E:(12, 13.2)F:(15, 13.6)Point G(17.968834511388888, 14.251390417263671)
AI Drawing Prompt Reference
Draw five data points in a coordinate system at (0, 10.7), (3, 11.1), (6, 11.9), (9, 12.5), and (12, 13.2), then plot a best-fit line passing through these points, label the line, and mark a point at (17.968834511388888, 14.251390417263671).
The prompt above was compiled from the original drawing commands and is for reference only.