
Linear Programming and Expected Value Exercise: 383 #7
Loading the math board and drawing, please wait…
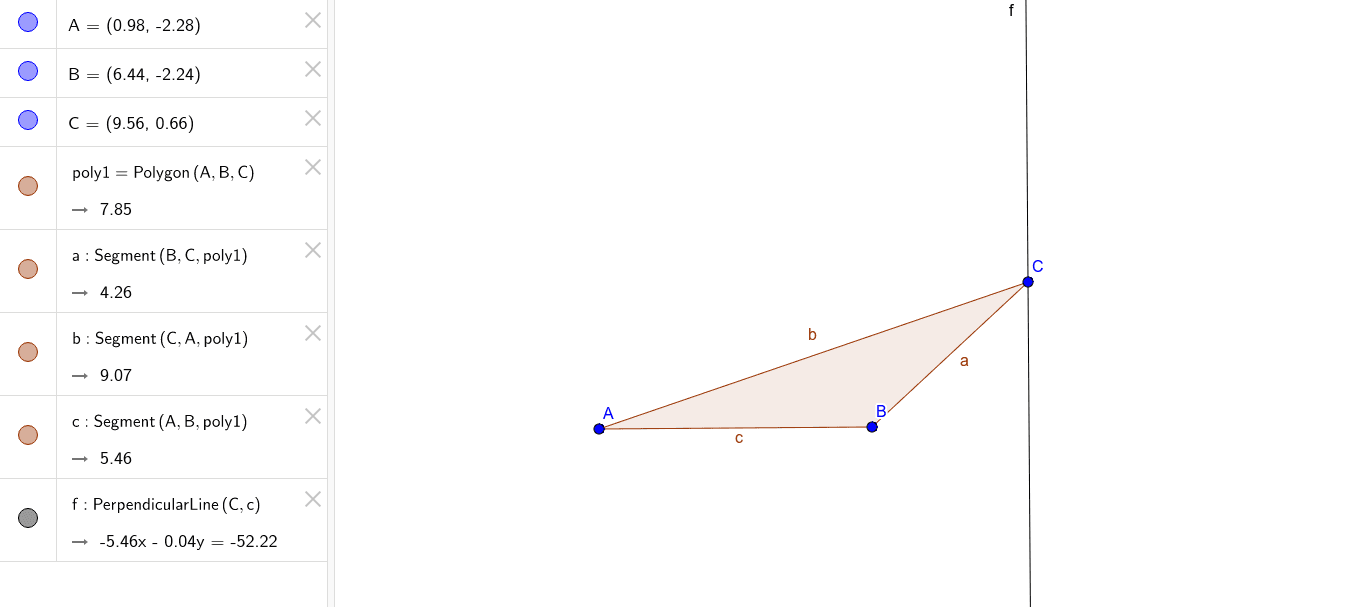
①This example demonstrates a comprehensive mathematical problem combining linear programming, expected value, inequalities, and data visualization (bar/pie charts), labeled as 383 #7, suitable for classroom practice or exam review. ②Core concepts include linear programming (objective function and constraints), expected value calculation, inequality regions, and the use of charts in decision-making. ③Construction: Based on the summary, GeoGebra commands Polygon and OrthogonalLine are used to build the feasible region and constraint boundaries, with objects A, B, C, polygon poly1, lines c, a, b, and function f, forming a geometric model of the optimization problem. ④This is ideal for high school or early college mathematics, helping students connect linear programming with probability and statistics, and can be used for teacher demonstrations or student self-study.
GeoGebra Commands & Parameters
Polygon(A, B, C) → poly1, c, a, bOrthogonalLine(C, c) → f