
Linear Functions Practice
Loading the math board and drawing, please wait…
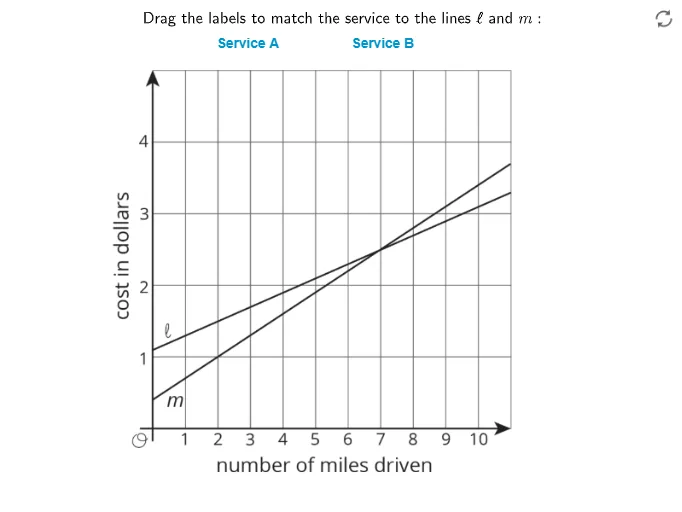
This example demonstrates the graph and properties of linear functions. Core math concepts include linear functions, slope, intercept, and function graphs. It uses GeoGebra commands like text1, text2, text3, points A and B, and image pic1. Suitable for middle school mathematics teaching to help students understand the basic characteristics of linear functions.
GeoGebra Commands & Parameters
Point A(-12.815536056726058, -6.914608067895841)Point B(0.6233784296675083, -6.914608067895841)
AI Drawing Prompt Reference
Draw a Cartesian coordinate plane. Place two points on the graph: one on the left at approximately (-12.8, -6.9) and another on the right at approximately (0.6, -6.9). Mark both points with small solid dots and connect them with a straight horizontal line. Add three text labels near the graph to indicate key concepts of linear functions, such as slope, intercept, and the graph of the function. The overall figure should illustrate the basic characteristics of a linear function for middle school math teaching.
The prompt above was compiled from the original drawing commands and is for reference only.