
Linear Functions: Interactive Exploration of Slope and Intercept
Loading the math board and drawing, please wait…
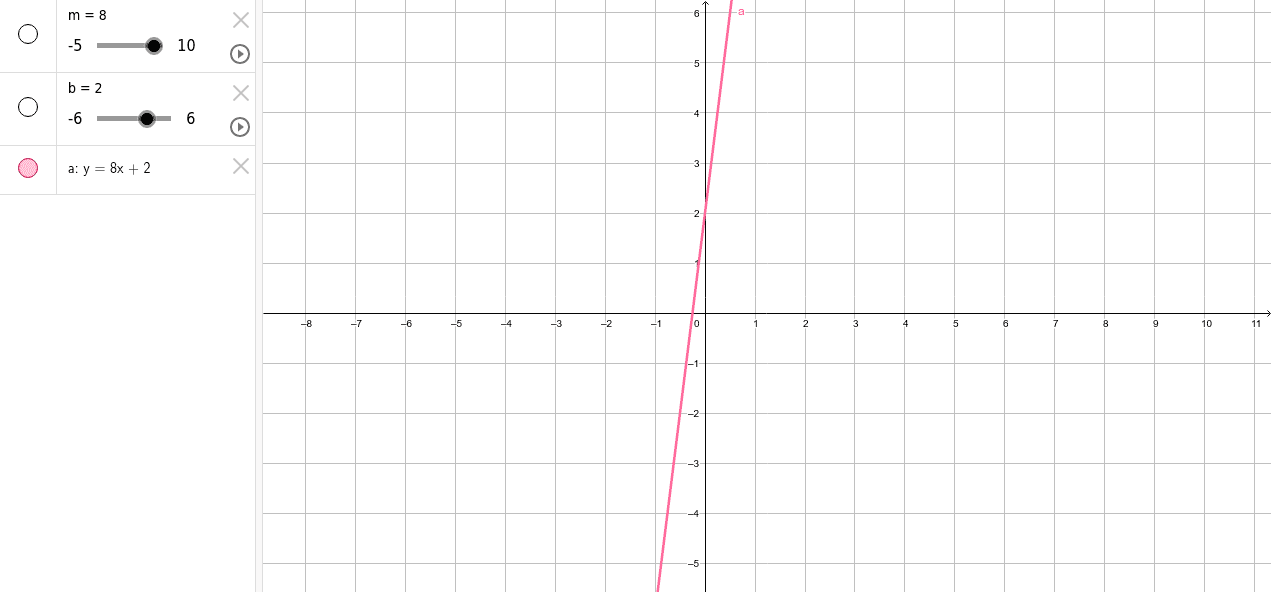
①This GeoGebra example dynamically demonstrates the graph of a linear function y = mx + b, showing how the slope m and y-intercept b affect the line's steepness and position. ②Core mathematical concepts include linear functions, slope, intercept, graphing, and the derivative as the slope of the line, with connections to linear programming and optimization. ③Construction: sliders for parameters m and b control the slope and intercept, while parameter a may be used for a specific point or auxiliary line; the graph updates in real time to visualize parameter changes. ④Suitable for middle school to high school students learning functions and coordinate geometry, as well as introductory calculus for understanding the geometric meaning of derivatives, or as a visual aid for linear programming objective functions.
GeoGebra Commands & Parameters
Numeric m(8)Numeric b(2)y = (m * x) + b