
Linear Functions in 2 Variables
Loading the math board and drawing, please wait…
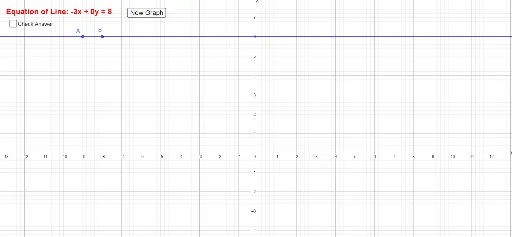
This example demonstrates the graph of linear functions in a 2D coordinate system and its properties. The core mathematical concepts involved include the definition of linear functions, slope, intercept, and graphing of functions. Key construction elements use GeoGebra commands like Random to generate random parameters, Line to draw lines, and multiple objects such as c, a, b, f, A, B, g, text1, d, button1, r, text2 to showcase function graphs and interactive operations. Suitable for high school mathematics teaching, helping students understand the characteristics of linear function graphs and the impact of parameter changes on the function graph.
GeoGebra Commands & Parameters
Random(-10, 10) → cRandom(-5, 5) → aRandom(-5, 5) → bLine(A, B) → g