
Linear Functions Dynamic Demo: Exploring Slope and Intercept
Loading the math board and drawing, please wait…
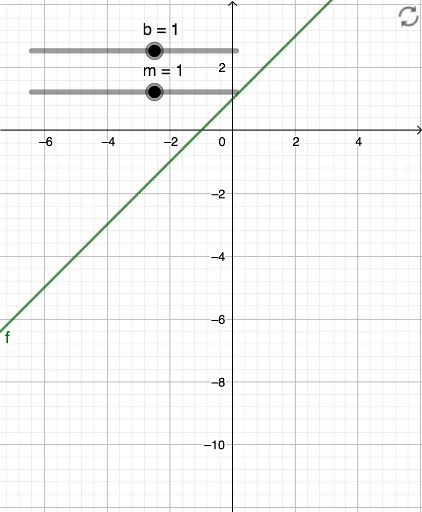
This GeoGebra example dynamically demonstrates the graph of a linear function y = mx + b, visually showing how the slope m and the y-intercept b affect the line's steepness and position. The core mathematical concepts include linear functions, slope, intercept, and the relationship between parameters and the function graph. The construction uses sliders to control parameters m and b, and the function command f(x) = m*x + b to generate the line, possibly with auxiliary objects like rectangles or cuboids to enhance spatial understanding. It is suitable for middle or high school students learning basic functions, and can be used for teacher demonstrations or student self-exploration, helping to understand how parameter changes alter the line's direction and location, laying a foundation for further study of linear equations and coordinate geometry.
GeoGebra Commands & Parameters
Numeric m(1)Numeric b(1)f(x) = (m * x) + b
AI Drawing Prompt Reference
Draw a Cartesian coordinate plane with a straight line whose slope and y-intercept are controlled by two sliders. The line should dynamically adjust its steepness and vertical position as the sliders move. Clearly mark the line's intersection with the y-axis. Keep the visualization clean and educational, emphasizing how changing the parameters alters the line's direction and location.
The prompt above was compiled from the original drawing commands and is for reference only.