
Linear Function Graphing by Gerrit Stols
Loading the math board and drawing, please wait…
In collections
Linear functions
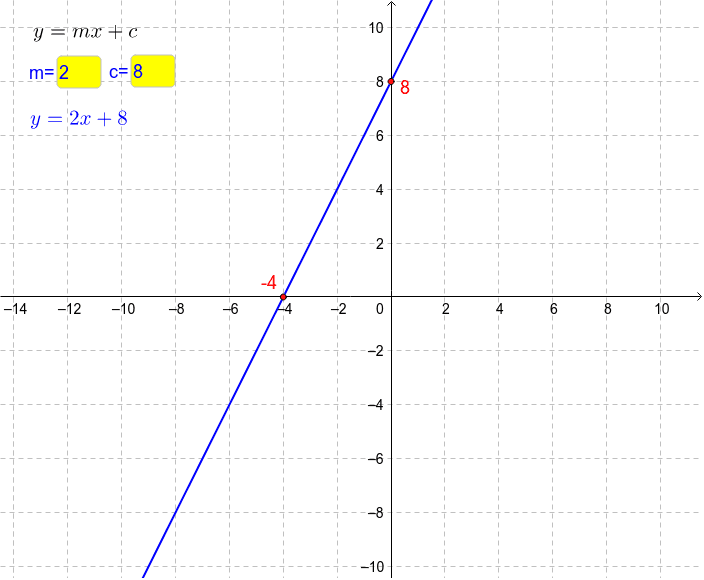
This example demonstrates how to graph the linear function y=mx+c using GeoGebra; core math concepts include linear functions, slope, y-intercept, and analytical geometry; construction highlights involve commands/objects like Textfield, Root, Intersect, and elements a, c, f, inputBox1, inputBox3, B, C, D, text4, text1, b, d, text2, text3; suitable for middle school students and above for learning function graphing and parameter influence analysis.
GeoGebra Commands & Parameters
Textfield(a) → inputBox1Textfield(c) → inputBox3Root(f) → B, CIntersect(f, yAxis) → D
AI Drawing Prompt Reference
Create a graph of a linear function that demonstrates how changing the slope and y-intercept affects the line's position, including sliders for these parameters, the intersection point of the line with the y-axis, and text labels for the coordinates of key points.
The prompt above was compiled from the original drawing commands and is for reference only.