
Linear Equation y=mx+c GeoGebra Demo
Loading the math board and drawing, please wait…
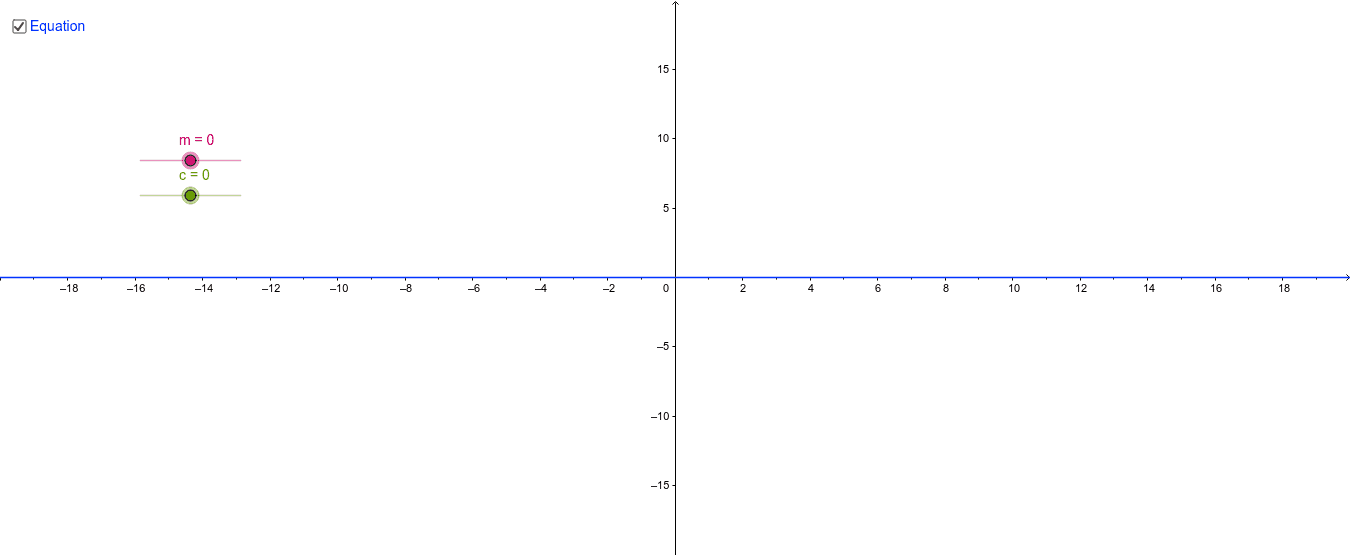
This example dynamically demonstrates the graph of the linear equation y=mx+c using GeoGebra, focusing on how slope m and y-intercept c affect the line. Core math concepts include linear functions, coordinate geometry, and parameter manipulation. It uses GeoGebra commands like 'If' for conditional logic, sliders for interactive exploration, and objects like 'Equation' to plot the function. Ideal for middle school and high school students learning about linear equations and their graphical representations.
GeoGebra Commands & Parameters
If(m ≠ 0, "y = " + m + "x + " + c, "y = " + c) → Equation_1