
Limits Worksheet: Graphical Exploration of Function Limits
Loading the math board and drawing, please wait…
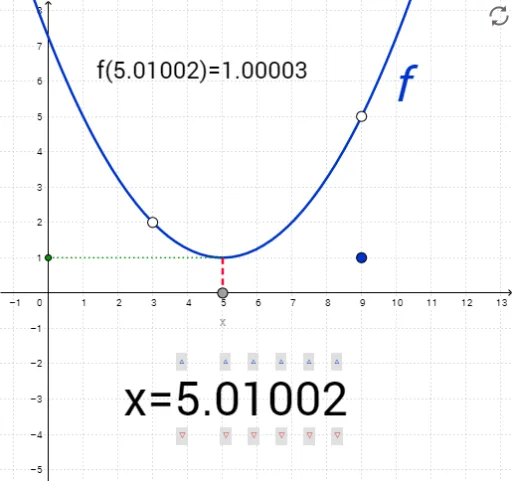
This interactive worksheet is designed for practicing the concept of limits, demonstrating how a function behaves near a specific point through graphical visualization. The core mathematical concepts include function limits, continuity, and intuitive understanding of limits via graphs. Construction details: using GeoGebra commands such as Point, OrthogonalLine, Intersect, and Segment, the worksheet includes multiple objects like origin, points D, D_1, D_2, various text elements (text2, text3 series), function f, parameters a and b, points A and B, likely to dynamically show the trend of function values as the independent variable approaches a target. Suitable for high school or early college calculus students, this resource serves as a classroom demonstration or self-study tool to reinforce the epsilon-delta definition and graphical approximation of limits.
GeoGebra Commands & Parameters
Point(xAxis) → originOrthogonalLine(argument, xAxis) → aIntersect(f, a, (5.010020000000003, 1.0000251001)) → valueSegment(value, argument) → bOrthogonalLine(value, yAxis) → cIntersect(c, yAxis) → APoint(c) → BSegment(A, B) → d
AI Drawing Prompt Reference
Draw a coordinate system with an origin on the x-axis. From the origin, draw a vertical line that intersects the function graph at a point. From this point, draw a line segment to the x-axis, and let it intersect the y-axis at a point. Then, draw a vertical line from this intersection point that intersects the function graph at another point. Finally, connect these two intersection points with a line segment to visualize the function's behavior near a specific point.
The prompt above was compiled from the original drawing commands and is for reference only.