
Limits, Rates of Change, and Tangent Lines by nun3
Loading the math board and drawing, please wait…
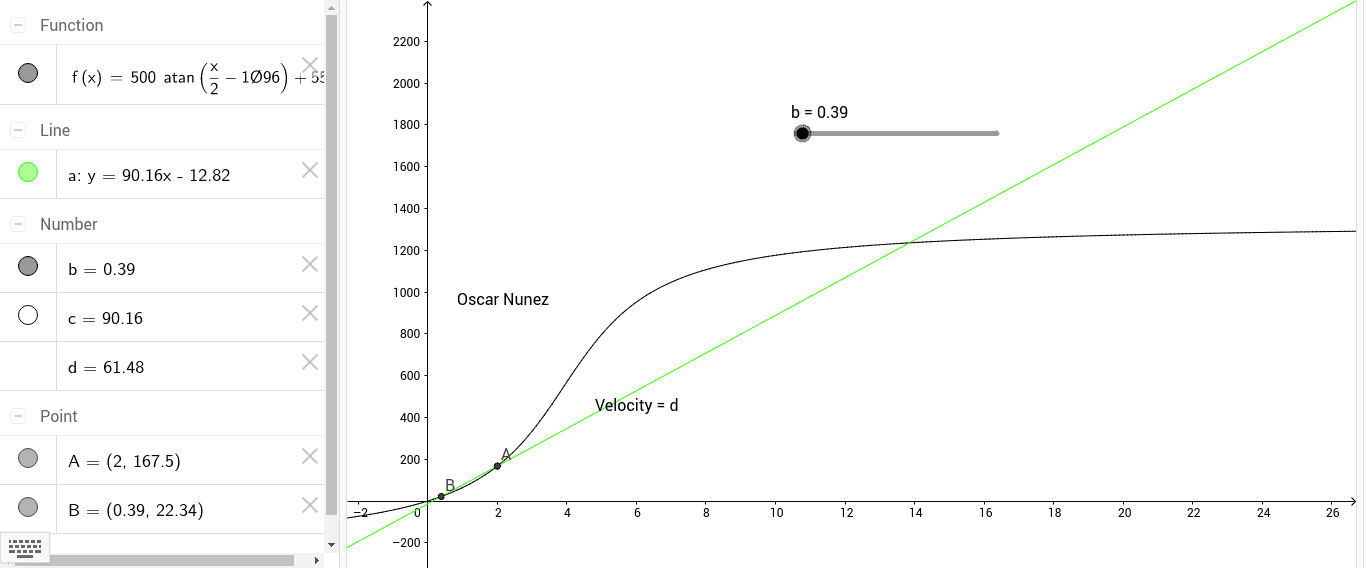
This example dynamically demonstrates the relationship between function graphs, tangent lines, and limit concepts, visually illustrating the connection between limits and tangents. Core math concepts include limits, rates of change (slope), tangent equations, and function graphs. Construction highlights the use of GeoGebra commands like Line and Slope, along with objects such as f (function), b, B, A, a, c, d, text2, text1. Suitable for high school calculus instruction to help students grasp the geometric meaning of limits, derivatives, and tangents.
GeoGebra Commands & Parameters
Line(B, A) → aSlope(a) → c
AI Drawing Prompt Reference
Draw a function graph and its tangent line at a specific point to illustrate the relationship between limits, derivatives, and tangents. First, draw the function graph, then select a point on the graph and draw the tangent line at that point, and display the slope of the tangent line.
The prompt above was compiled from the original drawing commands and is for reference only.