
Leaf Width Histogram
Loading the math board and drawing, please wait…
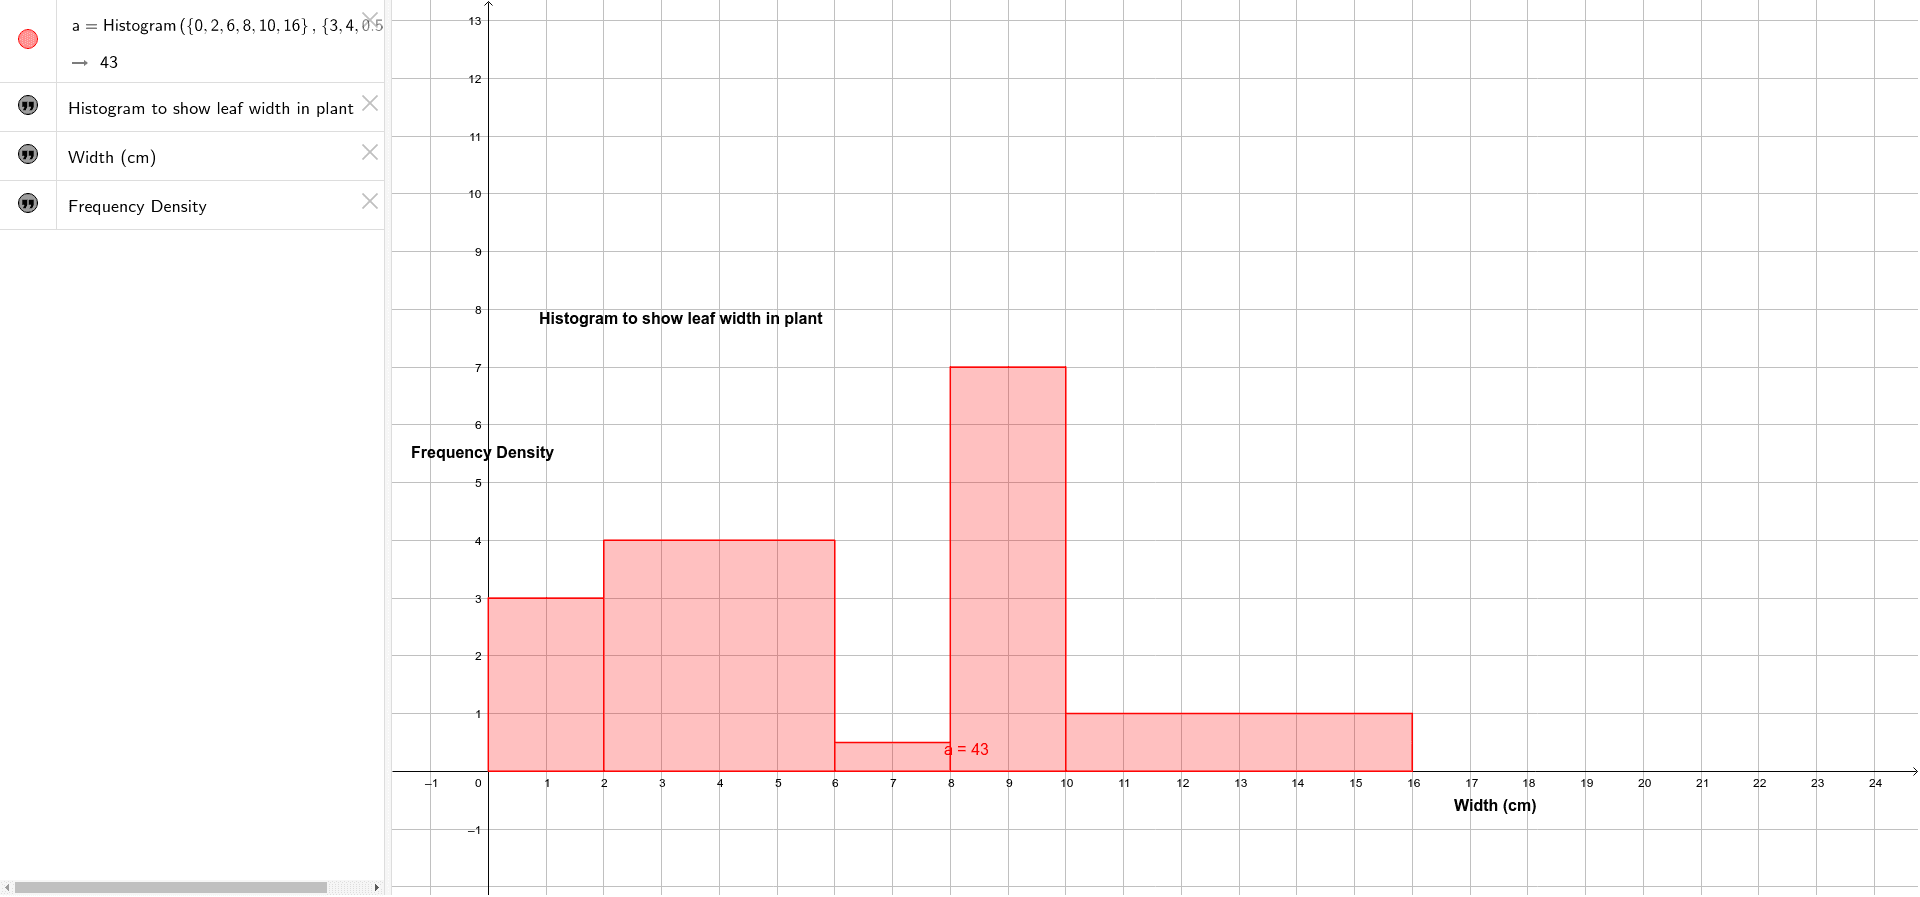
This example demonstrates a histogram of leaf width. A histogram is a type of statistical chart that shows the distribution of data. The example involves the concept of histograms and uses the GeoGebra command Histogram to create the histogram. Suitable for middle school and above students to learn data statistics and analysis.
GeoGebra Commands & Parameters
Histogram({0, 2, 6, 8, 10, 16}, {3, 4, 0.5, 7, 1}) → a
AI Drawing Prompt Reference
Create a histogram for leaf width data, with widths at 0, 2, 6, 8, 10, 16 and frequencies of 3, 4, 0.5, 7, 1 respectively. First enter the width data, then the frequencies, and finally generate the histogram.
The prompt above was compiled from the original drawing commands and is for reference only.