
Investigating Straight Lines: Dynamic Exploration of y = mx + b
Loading the math board and drawing, please wait…
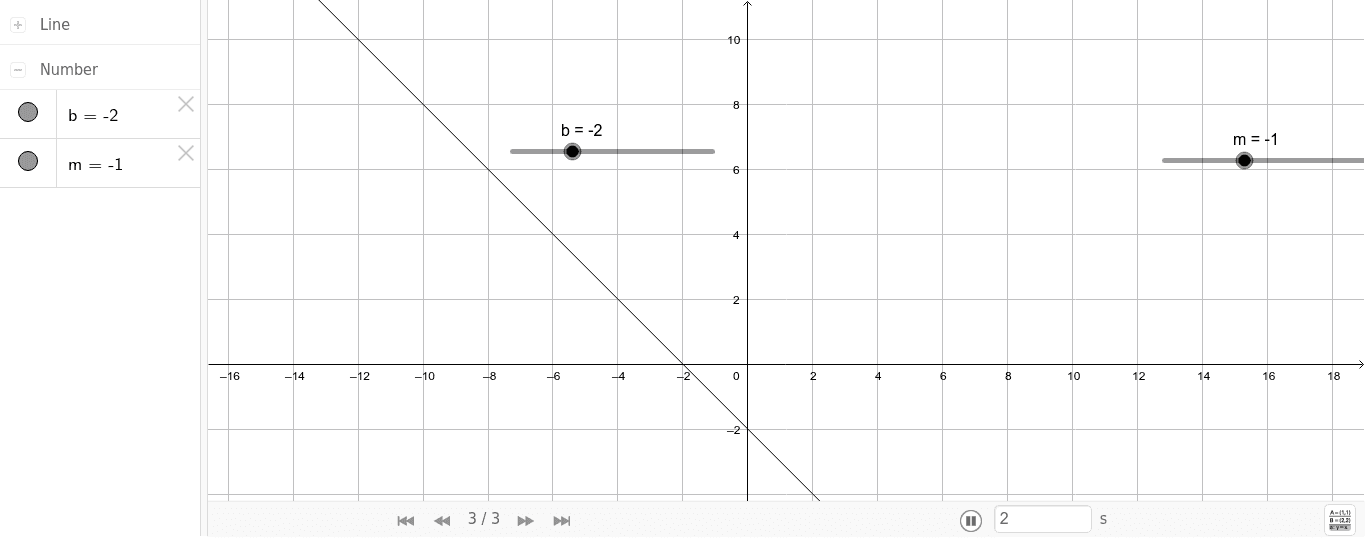
① This example demonstrates how a straight line y = mx + b changes dynamically as parameters m and b are adjusted via sliders, with an additional parameter a for extended exploration. ② Core mathematical concepts include linear functions, slope and intercept interpretation, and the effect of parameter variation on graphs, alongside related number theory topics such as natural numbers, geometric mean, LCM, and GCD that may be integrated into the construction. ③ Construction highlights: based on the summary, objects m, b, and a (likely sliders or numeric values) are used in GeoGebra to control the line's equation in real time, allowing users to observe the family of lines and parametric thinking. ④ Suitable for middle and high school students, this resource is ideal for teaching function graphs, dynamic geometry exploration, or math lab activities, bridging algebraic expressions with visual geometric understanding.
GeoGebra Commands & Parameters
Numeric m(-1)Numeric b(-2)y = (m * x) + b
AI Drawing Prompt Reference
Draw a straight line defined by y = m x + b with two sliders that adjust the slope m and intercept b, starting at -1 and -2 respectively; dragging the sliders updates the line in real time to show how the graph changes with the parameters. The construction begins by creating numeric controls for m and b, then plots the line using the equation, allowing continuous exploration of the family of lines.
The prompt above was compiled from the original drawing commands and is for reference only.