
Investigating General Linear Equations by David Coughlan
Loading the math board and drawing, please wait…
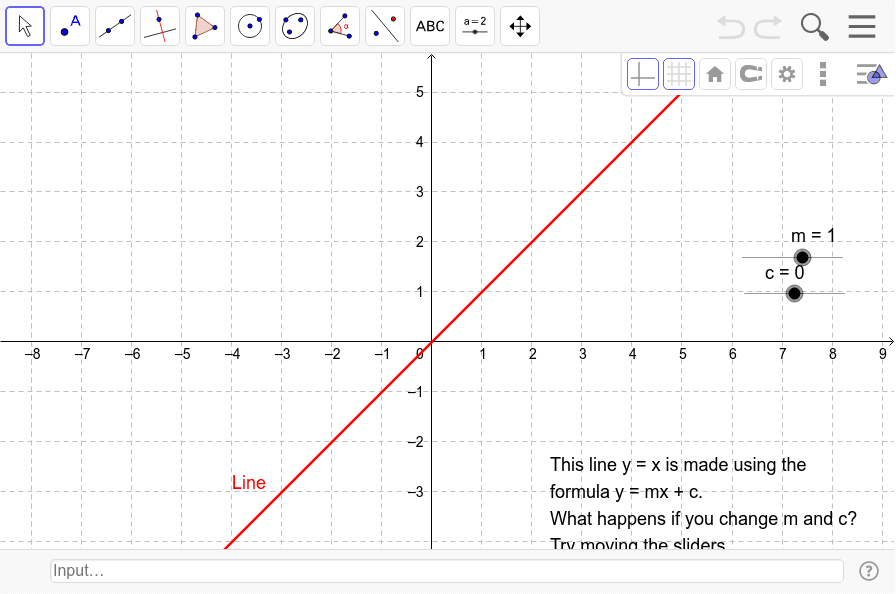
This example demonstrates how to dynamically adjust the slope (m) and y-intercept (c) parameters to observe the changes in the linear equation y=mx+c. Key math concepts include linear equations, slope, y-intercept, and analytical geometry. It utilizes GeoGebra commands/objects: Slider m, Slider c, Line, and Text1. Suitable for high school students learning about the properties of linear equations and for classroom demonstrations.
GeoGebra Commands & Parameters
Numeric m(1.0)Numeric c(0.0)y = m * x + c
AI Drawing Prompt Reference
Create a dynamic visualization showing how the line y=mx+c changes as the slope m and y-intercept c are adjusted using sliders. Include two sliders for m and c, a line that updates based on these values, and text displaying the current equation.
The prompt above was compiled from the original drawing commands and is for reference only.