
Investigating Cubic Graphs in Factorised Form
Loading the math board and drawing, please wait…
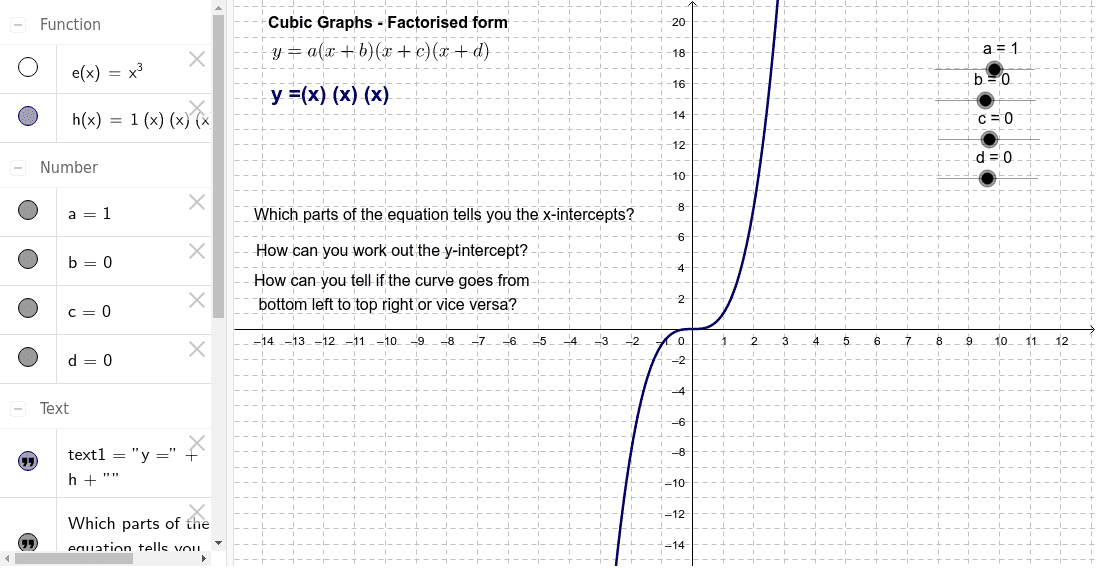
This example demonstrates how to explore cubic function graphs in the form y = a(x+b)(x+c)(x+d) by manipulating parameters a, b, c, and d using sliders. Key math concepts include function graphs, polynomial functions, factoring, and the impact of parameters. Constructed using GeoGebra commands/objects: objects d, c, b, a, h, e, text1, text2, text3, text4, text5, text6. Suitable for high school mathematics students learning about functions and graphs, to understand how parameter changes affect the shape and position of function graphs.
GeoGebra Commands & Parameters
Numeric d(0.0)Numeric c(0.0)Numeric b(0.0)Numeric a(1.0)h(x) = a * (x + b) * (x + c) * (x + d)e(x) = x^(3)
AI Drawing Prompt Reference
Draw a cubic function graph in factored form y = a(x+b)(x+c)(x+d), with parameters a, b, c, and d adjustable via sliders. Include a reference graph of y = x³ for comparison. The sliders should have initial values a=1, b=0, c=0, d=0. As the sliders move, the cubic curve changes its shape and position, illustrating how each parameter affects the roots and overall graph. Add text labels or annotations to highlight key features and guide understanding of parameter effects.
The prompt above was compiled from the original drawing commands and is for reference only.