
Investigate Spread
Loading the math board and drawing, please wait…
In collections
statistics
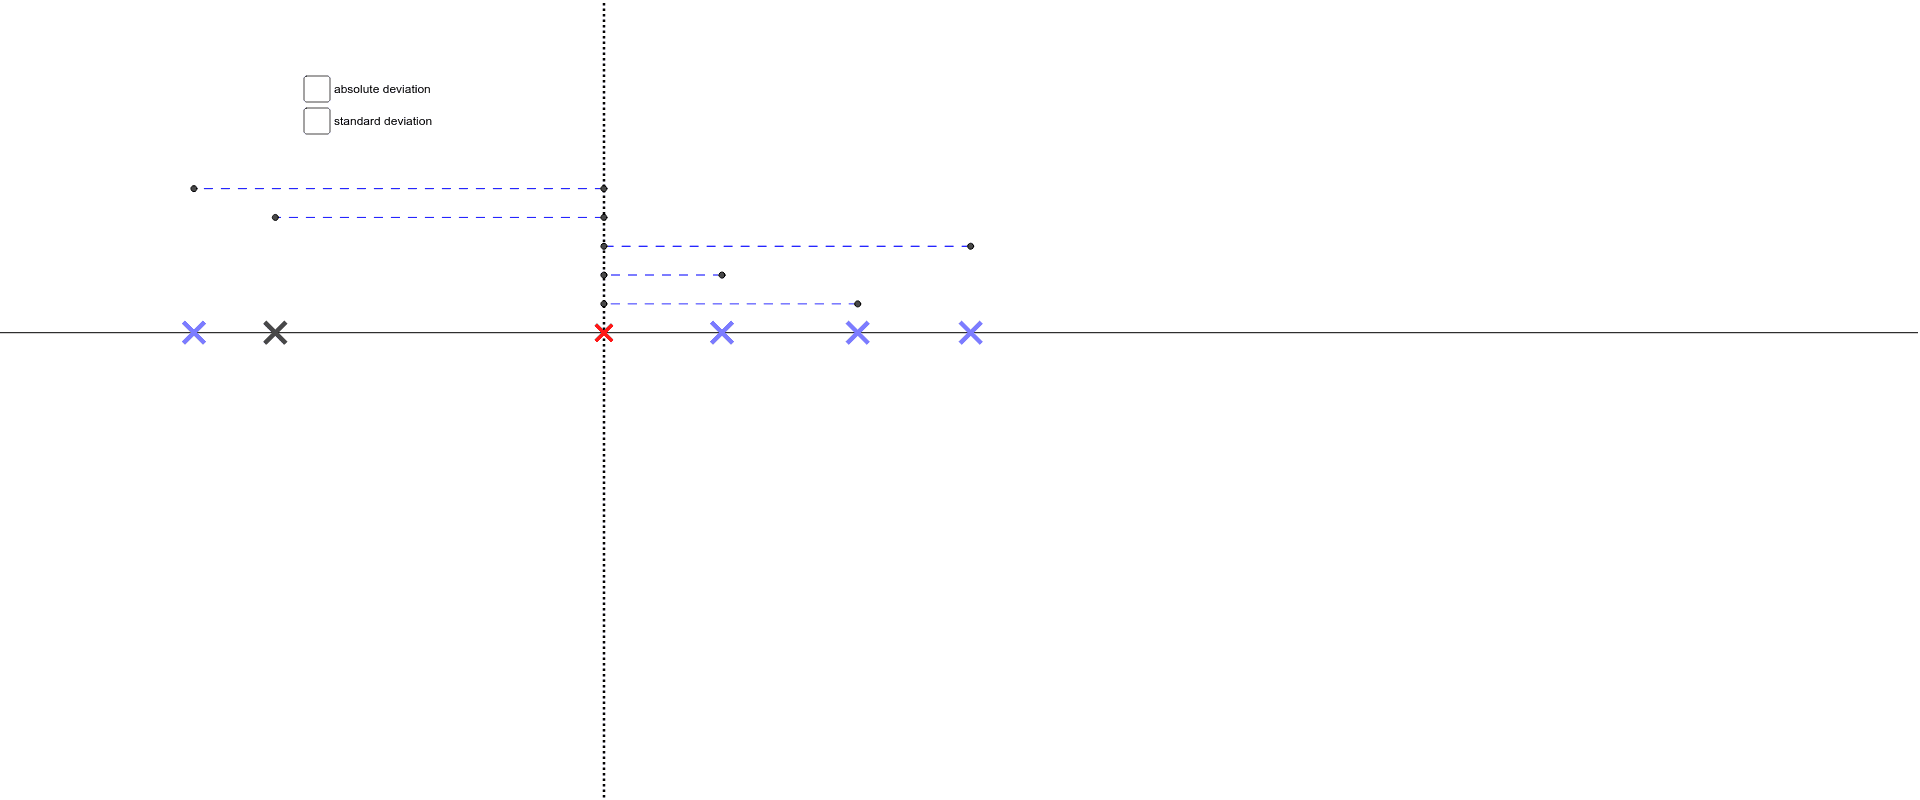
This example demonstrates how to investigate data spread using GeoGebra, focusing on the impact of exponential functions and standard deviation on data shape. Core math concepts include exponential functions, standard deviation, limits, and centroid. Construction highlights involve commands like Point, OrthogonalLine, Intersect, and Segment. Suitable for high school and above learners to understand the connection between data distribution and key mathematical concepts.
GeoGebra Commands & Parameters
Point(a) → APoint(a) → BPoint(a) → CPoint(a) → DPoint(a) → EOrthogonalLine(C, a) → hOrthogonalLine(B, a) → iOrthogonalLine(D, a) → jOrthogonalLine(F, a) → kOrthogonalLine(E, a) → lOrthogonalLine(A, a) → mIntersect(h, b) → GIntersect(c, i) → HIntersect(d, j) → IIntersect(e, k) → JIntersect(f, l) → KIntersect(f, m) → LIntersect(e, m) → MIntersect(d, m) → NIntersect(c, m) → OIntersect(b, m) → PSegment(G, P) → nSegment(H, O) → pSegment(I, N) → qSegment(M, J) → rSegment(L, K) → sSegment(R, Q) → a_1Segment(T, S) → b_1