
Intuitive Concept of Limits by Mike May
Loading the math board and drawing, please wait…
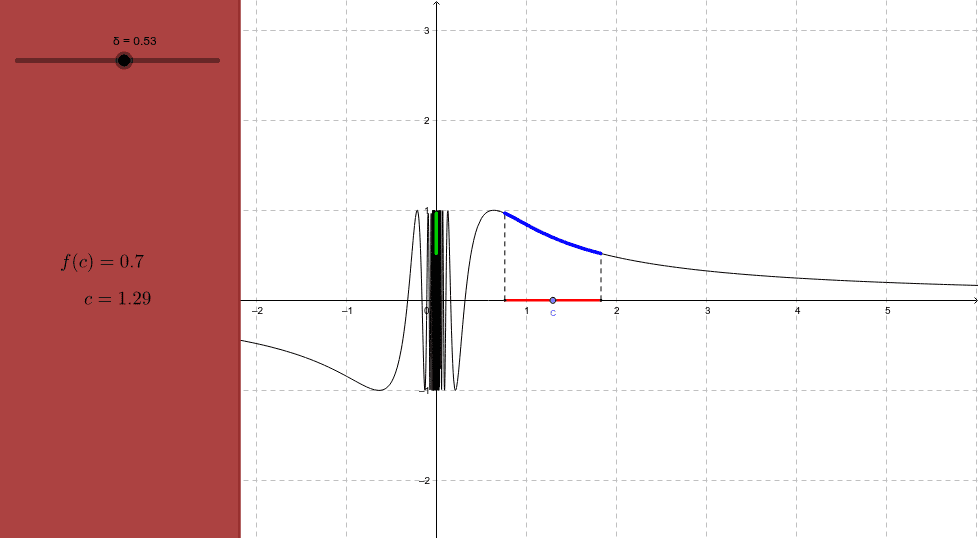
This example dynamically demonstrates the intuitive concept of limits using function graphs and moving points to explain the behavior of function values as the independent variable approaches a certain value. Core mathematical concepts involved include limits, functions, real numbers, and similarity transformations. Construction highlights the use of GeoGebra commands and objects such as points, segments, loci, functions, and create panels. Suitable for high school and above students to learn and understand the concept of limits in calculus.
GeoGebra Commands & Parameters
Point(xAxis) → ASegment(L, R) → δsegSegment(L, (a, f(a))) → dashLeftSegment(R, (b, f(b))) → dashRightPoint(Segment[L, R]) → PLocus(Q, P) → rangeFunction(f, a, b) → gCreatePanel(240) → poly1, d
AI Drawing Prompt Reference
Draw a dynamic illustration of the concept of limits, featuring a function curve and two moving points that demonstrate the behavior of function values as the independent variable approaches a certain value, highlighting core mathematical concepts like limits, functions, real numbers, and similarity transformations. Start by plotting the locus representing the limit range, then draw dashed segments on both sides and a moving point in the middle, followed by the function curve and a panel for display.
The prompt above was compiled from the original drawing commands and is for reference only.