
Introductory Questions on Limits
Loading the math board and drawing, please wait…
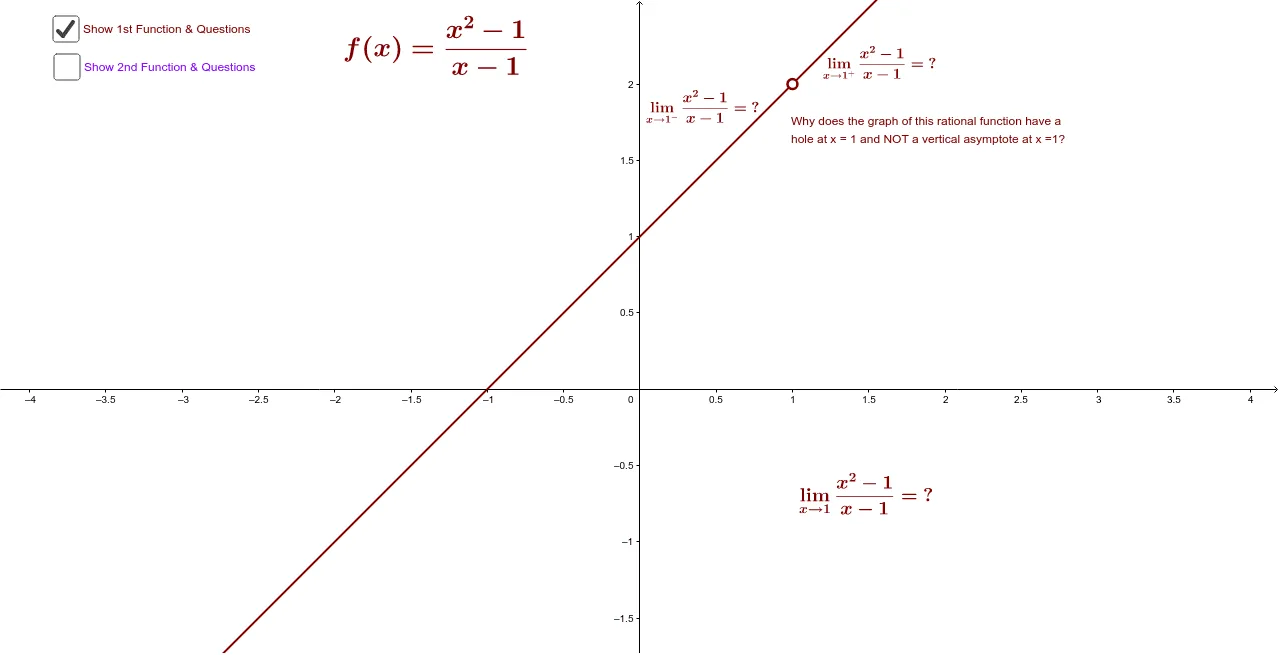
This example demonstrates the initial application of limit concepts through dynamic graphics, illustrating the process of solving function limits. Key math concepts involved include limits, roots, histograms, probability, and differential equations. Construction highlights from the GeoGebra command summary involve objects like B, g, h, text1, a, q, f, A, text2, text3, text4, c, etc. Suitable for high school mathematics teaching or self-study to understand the basic ideas and applications of limits.
GeoGebra Commands & Parameters
Point B(1.0, 0.5)g(x) = If[(-Infinity) ≤ x ≤ 0.95, (x - 1) / (x^(2) - 1)]h(x) = If[1.05 ≤ x ≤ Infinity, (x - 1) / (x^(2) - 1)]Line a(1.0, 0.0)q(x) = If[(-Infinity) ≤ x ≤ 0.97, (x^(2) - 1) / (x - 1)]f(x) = If[1.03 ≤ x ≤ Infinity, (x^(2) - 1) / (x - 1)]Point A(1.0, 2.0)Boolean c(true)Boolean b(false)
AI Drawing Prompt Reference
Draw a function graph showing the limit behavior of the function as x approaches 1. First, draw a horizontal line at y=0. Then, draw two piecewise functions g(x) from negative infinity to 0.95 and h(x) from 1.05 to positive infinity. Next, draw two quadratic functions q(x) from negative infinity to 0.97 and f(x) from 1.03 to positive infinity. Finally, place two points B and A at x=1, with B at y=0.5 and A at y=2.
The prompt above was compiled from the original drawing commands and is for reference only.