
Introduction to Systems of Linear Equations
Loading the math board and drawing, please wait…
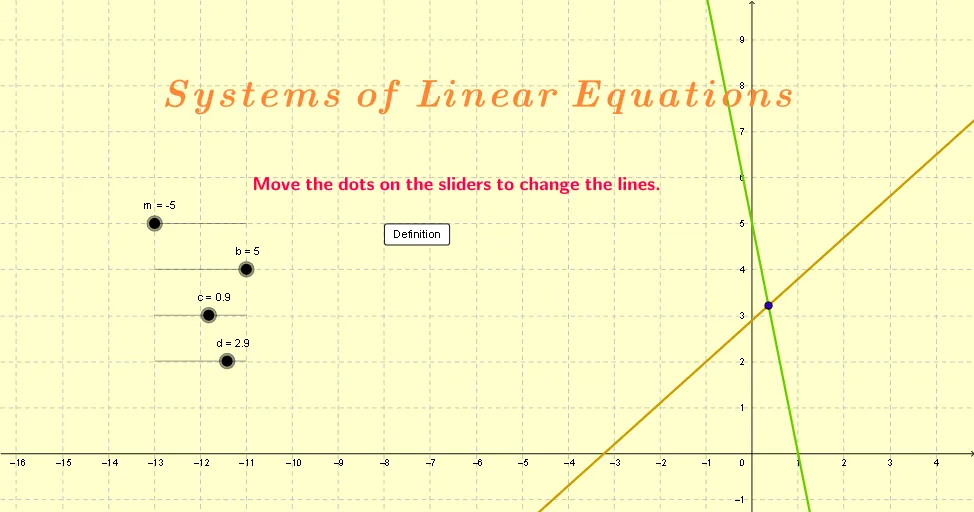
This example demonstrates how to understand and solve systems of linear equations through graphical methods. It involves core math concepts like linear equations, plane figures, variance, continuity, angles, and logarithmic functions. The construction uses GeoGebra commands like LaTeX for text, Intersect for finding intersections, and parameters such as m, b, a, c, d, e to build function graphs and intersection points. It is suitable for high school and above students to visually grasp the solution methods and geometric interpretations of linear systems.
GeoGebra Commands & Parameters
LaTeX(a, true, true) → text1LaTeX(e, true, true) → text2Intersect(a, e) → A
AI Drawing Prompt Reference
Draw a coordinate plane with two straight lines, one in slope-intercept form and the other in a different linear form, intersecting at a single point. Mark the intersection point clearly and label each line with its equation nearby. The graph should illustrate the geometric meaning of a system of linear equations, where the intersection represents the solution. Include axes, lines, the intersection point, and text labels for a clear educational demonstration.
The prompt above was compiled from the original drawing commands and is for reference only.