
Introduction to Double Number Line Diagrams
Loading the math board and drawing, please wait…
In collections
Unit 2 Classwork: Intro to Ratios
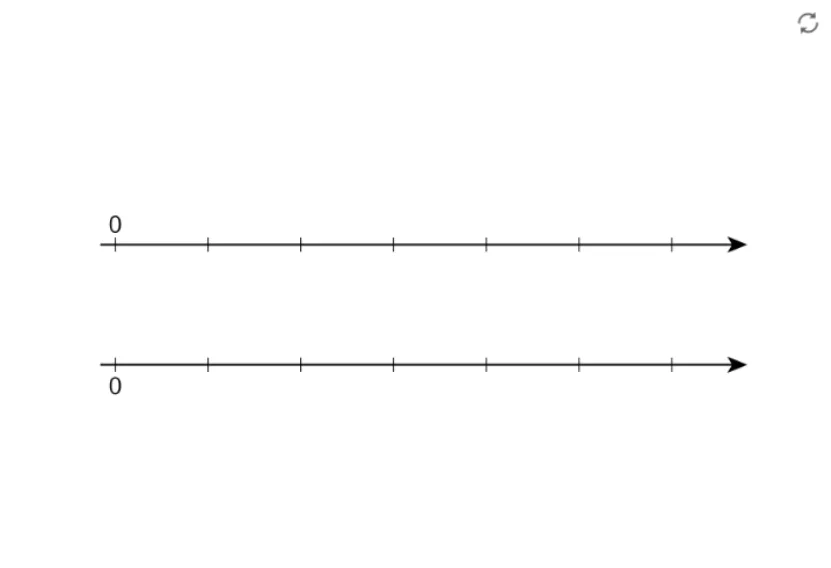
This lesson demonstrates how to use double number line diagrams to show the relationship between two quantities. Key mathematical concepts include ratios and scales. Using GeoGebra commands A and B, the construction process of the double number line diagram is visually illustrated. Suitable for middle school and above students to learn about ratios and scales.
GeoGebra Commands & Parameters
Point A(-13, 3)Point B(3, 3)
AI Drawing Prompt Reference
Draw a horizontal line as the base of a double number line diagram. Place two points on this line, one on the left and one on the right, both at the same height, with the left point positioned further left and the right point further right. These two points represent two quantities and their relationship, forming the initial structure of the double number line. The diagram should be simple and clear, emphasizing the concept of ratio and scale, suitable for illustrating the proportional relationship between two quantities.
The prompt above was compiled from the original drawing commands and is for reference only.