
Intro to Limits: Secant Approximation on Function Graphs
Loading the math board and drawing, please wait…
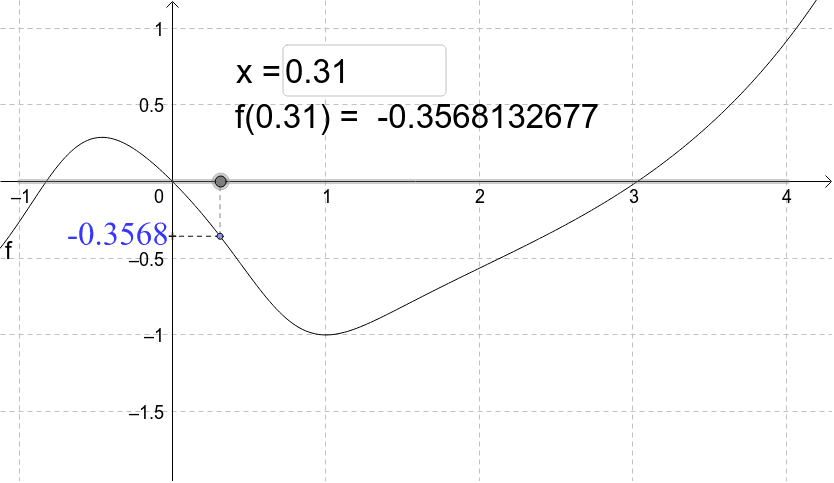
This GeoGebra example demonstrates how secant segments and labeled points approach a limiting behavior on a function graph. It introduces limits, functions, secant slopes, rational numbers, and linear equations. The construction uses Segment to draw secant segments, Textfield for yLabel1 and yLabel2, and objects f, a, b, c, A, B, C, and fC to represent the function, parameters, key points, and function values. It is suitable for high school or early calculus instruction.
GeoGebra Commands & Parameters
Segment(A, B) → cSegment(A, (a, 0)) → bTextfield(a) → C
AI Drawing Prompt Reference
Draw a function graph with two points on it. Connect these two points with a straight line segment to form a secant line. Draw another vertical line segment from the first point down to the x-axis to indicate its x-coordinate. Label the coordinates of both points on the graph. Include an input text field to adjust the position of the second point, allowing observation of how the secant slope changes, demonstrating the concept of a limit.
The prompt above was compiled from the original drawing commands and is for reference only.