
Intersection of Cartesian Parabola and Circle
Loading the math board and drawing, please wait…
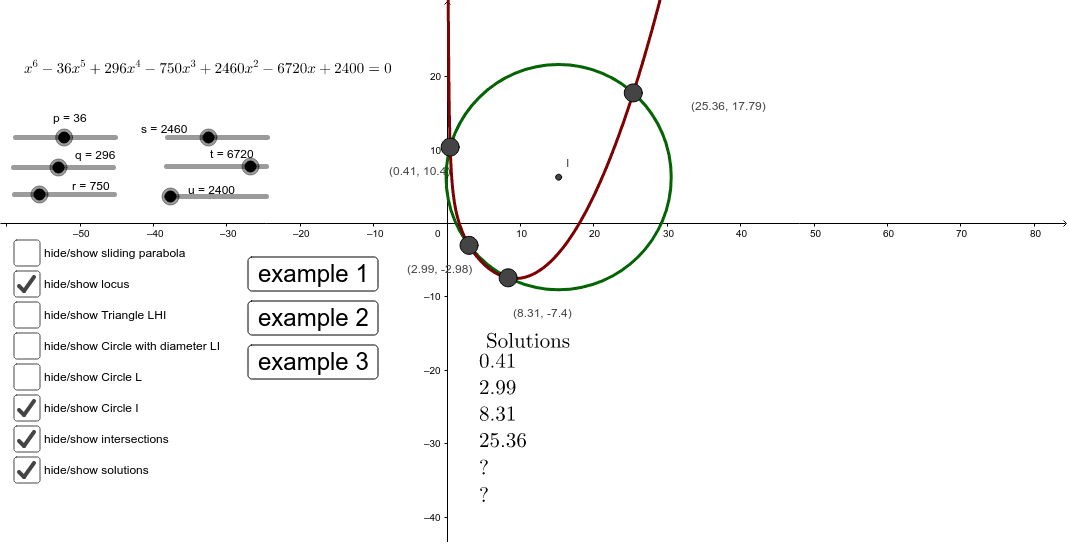
This example demonstrates the intersection points of a Cartesian parabola and a circle. Key mathematical concepts include the intersection of curves in coordinate geometry, root solving, and the construction of orthogonal lines. Using GeoGebra commands such as Point, Circle, Root, and OrthogonalLine, the dynamic changes in intersection points are visually illustrated. Suitable for high school mathematics education, particularly for coordinate geometry and function graphing.
GeoGebra Commands & Parameters
Point({h, k}) → OCircle(O, d) → cRoot(g) → A, B, C, D, F, GOrthogonalLine(A, e) → iOrthogonalLine(B, e) → lOrthogonalLine(C, e) → mOrthogonalLine(D, e) → a_1Intersect(f, l, (2.9868060725339998, -2.982346512378994)) → H_1Intersect(f, l, (2.9868060725339998, -2.982346512378994)) → I_1Intersect(f, m, (8.314549691799938, -7.403901038585482)) → MIntersect(f, a_1, (25.359085660117678, 17.78529354637122)) → NIntersect(f, i, (0.41291792669726235, 10.399494905323442)) → EOrthogonalLine(G, e) → jOrthogonalLine(F, e) → b_1Intersect(f, b_1, (8.154731189963634, -3.3615622611948153)) → JIntersect(f, j, (9.768321159071533, -3.126750114223364)) → KPoint(yAxis) → L_1Point({b, 0}) → P_1Point({0, o + a}) → QLine(P_1, Q) → c_1Function(f, 0, 100) → g_1Point({0, (-a)}) → LPoint({0, k}) → HOrthogonalLine(H, d_1) → e_1Point({h, k}) → ISegment(L, H) → h_1Segment(H, I) → i_1Segment(I, L) → j_1Midpoint(j_1) → RCircle(R, I) → k_1Circle(L, v) → p_1Intersect(k_1, p_1) → S, P, ,Circle(I, P) → q_1Intersect(r_1, s_1) → T, U, V, W, Z, A_1OrthogonalLine(T, s_1) → t_1OrthogonalLine(U, s_1) → a_2OrthogonalLine(V, s_1) → b_2OrthogonalLine(W, s_1) → c_2OrthogonalLine(Z, s_1) → d_2OrthogonalLine(A_1, s_1) → e_2Intersect(f, e_2, (9.768321159071533, -3.126750114223364)) → B_1Intersect(f, d_2, (8.154731189963634, -3.3615622611948153)) → C_1Intersect(f, c_2, (25.359085660117678, 17.78529354637122)) → D_1Intersect(f, b_2, (8.314549691799938, -7.403901038585482)) → E_1Intersect(f, a_2, (2.9868060725339998, -2.982346512378994)) → F_1Intersect(f, t_1, (0.41291792669726235, 10.399494905323442)) → G_1Intersect(f_1, c_1) → J_1, K_1
AI Drawing Prompt Reference
Draw a Cartesian parabola and a circle intersecting in a coordinate system. First, plot the parabola and circle, then find their intersection points. Next, draw perpendicular lines from these points to the parabola and mark their intersections. Finally, add some auxiliary line segments and midpoint circles to illustrate orthogonality and symmetry.
The prompt above was compiled from the original drawing commands and is for reference only.