
Interpreting z-scores
Loading the math board and drawing, please wait…
In collections
MA336
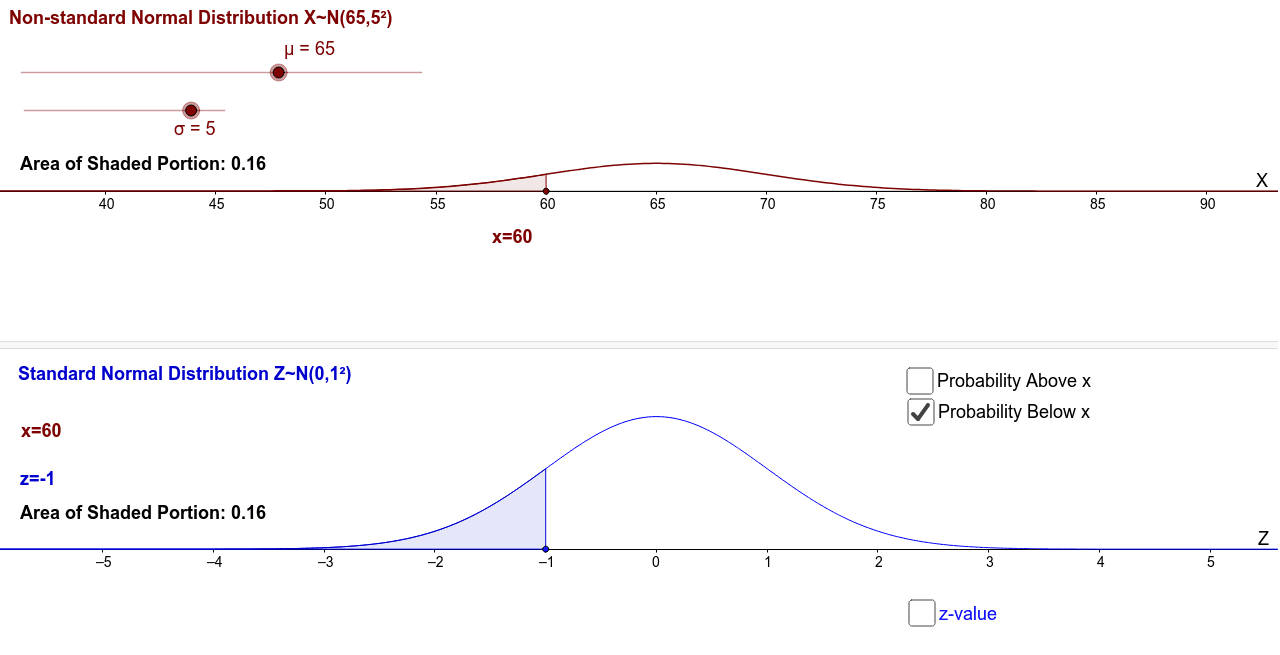
This activity visualizes the relationship between a normal distribution, the standard normal distribution, and z-scores, helping students understand the concept of z-scores. Key mathematical concepts include normal distribution and statistics. Using GeoGebra commands like Normal, Point, Integral, If, etc., users can dynamically adjust the mean and standard deviation to observe changes in z-scores. Suitable for high school mathematics and statistics courses.
GeoGebra Commands & Parameters
Normal(0, 1, x, false) → gNormal(μ, σ, x, false) → fPoint(xaxis) → xbIntegral(f, -25, x(xb)) → pb1Integral(g, -10, x(Z)) → pb2Integral(f, x(xb), 1000) → pa1Integral(g, x(Z), 10) → pa2If(pa ≟ true, text4, text5) → probPoint(xaxis_1) → xb_1Point(xaxis_2) → xb_2
AI Drawing Prompt Reference
Draw a standard normal distribution curve g, then draw a normal distribution curve f that can be adjusted by mean μ and standard deviation σ. Create two points xb and xb_1 on the x-axis to calculate the area pa1 to the left of xb on f and the area pb2 to the left of Z on g. Display the corresponding probability text based on the comparison of pa1 and pb2. Finally, create another point xb_2 on the x-axis for further adjustment.
The prompt above was compiled from the original drawing commands and is for reference only.