
Interpreting Graphs of Proportional Relationships
Loading the math board and drawing, please wait…
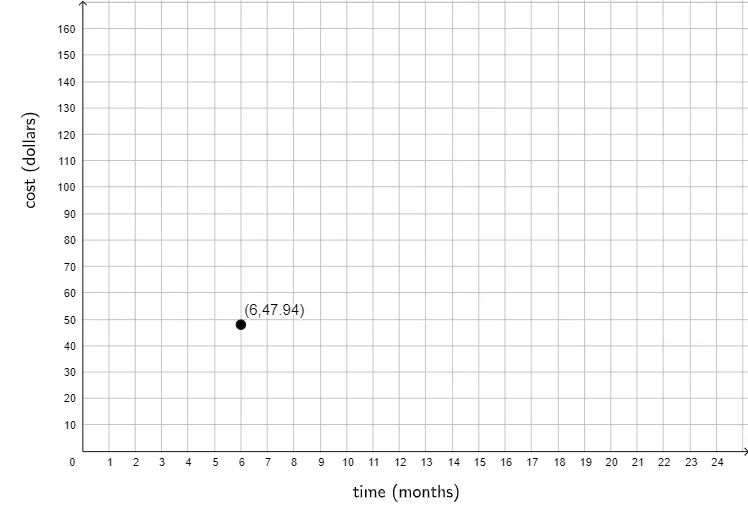
This example demonstrates how to draw and interpret graphs of proportional relationships using GeoGebra. It involves core math concepts like proportional relationships, coordinate geometry, and linear functions. Construction highlights include using GeoGebra commands/objects A, text1, text2. Suitable for middle school students learning about graph characteristics of proportional relationships.
GeoGebra Commands & Parameters
(6, 47.94)
AI Drawing Prompt Reference
Draw a coordinate plane with x and y axes. Plot a single point at coordinates (6, 47.94) in the first quadrant. This point represents a pair of values in a proportional relationship. From the origin, draw a straight line that passes through this point, illustrating the linear nature of proportional relationships. Add text labels near the point to indicate its coordinates and explain that the ratio of y to x is constant. Ensure the axes are clearly marked with scales, and the origin is visible. The graph should help interpret how the point lies on the line, showing the direct proportionality between the two quantities.
The prompt above was compiled from the original drawing commands and is for reference only.