
Intercept Form of a Quadratic Function
Loading the math board and drawing, please wait…
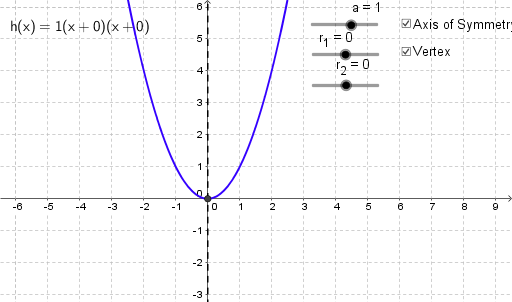
This example demonstrates the graphical representation and properties of the intercept form of a quadratic function. Key math concepts include quadratic functions, intercept form, vertex, axis of symmetry, etc. GeoGebra commands/objects used in construction: a (coefficient), r_1, r_2 (roots), c (constant term), b (coefficient), A, B (auxiliary points), Vertex (vertex), f (function graph), V (vertex coordinates), d (distance), text2 (text). Suitable for high school mathematics teaching to understand the image characteristics and properties of quadratic functions.
GeoGebra Commands & Parameters
Numeric a(1.0)Numeric r_1(0.0)Numeric r_2(0.0)y = ((a * (x - r_1)) * (x - r_2))x = (r_1 + r_2) / 2(r_1, 0)(r_2, 0)Boolean Vertex(true)f(x) = ((a * (x - r_1)) * (x - r_2))((r_1 + r_2) / 2, f((r_1 + r_2) / 2))Boolean d(true)
AI Drawing Prompt Reference
Draw a quadratic function graph in intercept form a(x - r1)(x - r2), with a=1, r1=0, and r2=0. Start by plotting the two intercept points on the x-axis, then use these points and the value of a to construct the quadratic function graph. Next, find the vertex, which is the midpoint between the two intercept points, and finally draw the vertex and its coordinates.
The prompt above was compiled from the original drawing commands and is for reference only.