
Interactive Visualization of Normal Distribution and Hypothesis Testing
Loading the math board and drawing, please wait…
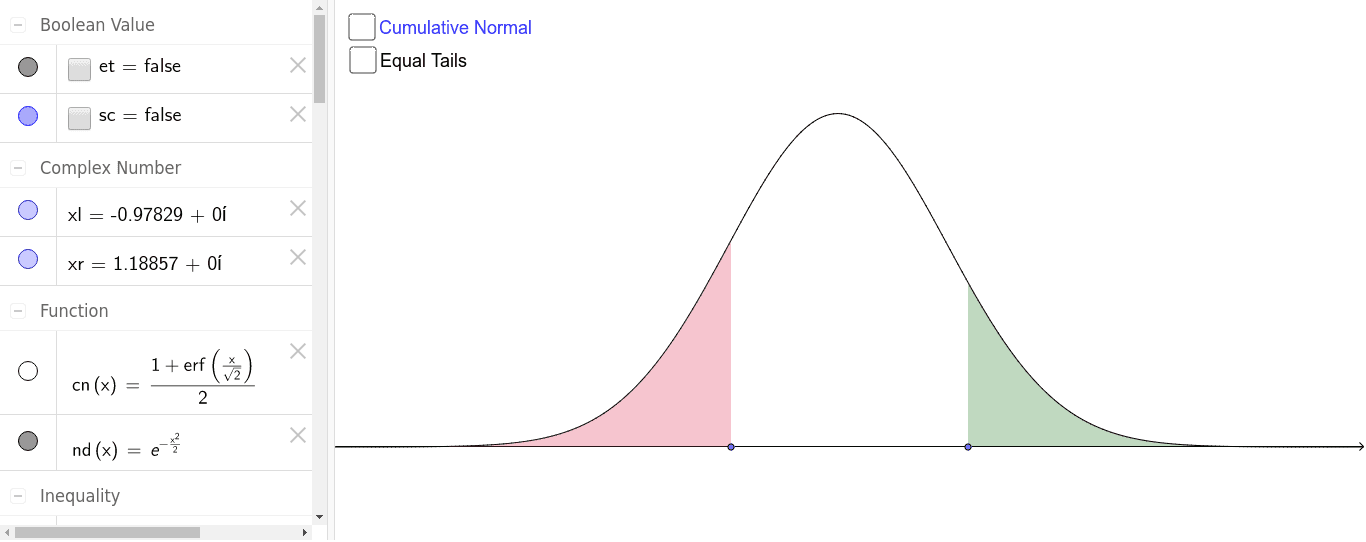
This GeoGebra example demonstrates the normal distribution curve in relation to hypothesis testing and boxplots, providing an interactive environment to explore distribution shapes and critical regions. Core mathematical concepts include the probability density function of the normal distribution, standard normal distribution, significance level α in hypothesis testing, critical Z-values, and left/right tail areas. Construction highlights: using GeoGebra commands such as Point, OrthogonalLine, Intersect, Midpoint, Polygon, Vector, Textfield, and Text to build auxiliary points, perpendicular lines, shaded regions, and dynamic labels. Multiple sliders (e.g., α, a, Z) allow users to adjust distribution parameters and test thresholds. This resource is suitable for high school and university statistics courses, helping students intuitively grasp properties of the normal distribution, rejection regions, and p-values, as well as the connection between boxplots and normal data.
GeoGebra Commands & Parameters
Point(xAxis) → xlPoint(xAxis) → xrOrthogonalLine(xl, xAxis) → llOrthogonalLine(xr, xAxis) → lrIntersect(cn, ll, (-0.9782857142857156, 0.16396651670880374)) → ClIntersect(nd, ll, (-0.9782857142857156, 0.6196989586733047)) → NlIntersect(nd, lr, (1.188571428571429, 0.4934414742228216)) → NrIntersect(cn, lr, (1.188571428571429, 0.8826958217353845)) → CrMidpoint(Nl, Nr) → NmTextfield(α) → alphaIntersect(cn, a, (-1.9599639845402432, 0.02499999999998892)) → ZPolygon((-0.1, y(Zl)), (0.1, y(Zl)), (0.1, y(Zr)), (-0.1, y(Zr))) → mid, b, c, d, ePolygon((-0.1, 0), (0.1, 0), (0.1, 1), (-0.1, 1)) → m, m_2, m_3, m_4, m_5Vector(Zr, (0.1, y(Zr))) → mrVector(Zl, (-0.1, y(Zl))) → mlVector(xl, Zl) → zlVector(xr, Zr) → zr
AI Drawing Prompt Reference
Draw a normal distribution curve with two vertical lines indicating the α level, a horizontal line intersecting the vertical lines to form shaded regions representing the left and right tail rejection regions. Use a slider to adjust the α value and display the standard normal distribution curve and confidence interval. Add a text field to show the α value and place auxiliary points and vectors at appropriate positions.
The prompt above was compiled from the original drawing commands and is for reference only.